The solar industry has experienced massive growth in recent years and in the United States alone, the market is expected to quadruple in size by 2030. Other related markets such as battery storage and EV charging, are also experiencing rapid growth. This opens the door for many installers and service providers – but you must be prepared. Solar field service software is one way to do this.
As your solar operations start to scale, you’ll need to assess the impact of soft costs on your solar operations. Everything from field service technicians arriving to sites without enough context, to having too many tools and dispersed service history. These insidious and often hidden costs can make service a challenging business to grow and scale profitably.

Solar Service Reports
LOOXY™ Analytics by Scoop is a new and advanced business intelligence (BI) and analytics platform built atop the best-in-class Scoop® mPMA platform. LOOXY captures detailed data within Scoop as your teams execute service operations using Work Apps™, and presents your solar project, installation, and service reports in a way that is useful for making more informed business decisions.
LOOXY’s unique pricing model includes unlimited users and dashboards, allowing each user to drilldown on the data that is most relevant to them. These dashboards help to inform and engage today’s often remote and multi-organizational team members, as well as cultivate a healthy environment of teamwork, performance, and achievement.
The Challenge
Identifying areas of opportunity across your solar operations and your organization as a whole can be difficult or impossible when data becomes disjointed, disorganized, and altogether outdated. Unfortunately, it is not uncommon for different data types to be collected in various platforms, often resulting in a time consuming and manual process to collect, consolidate, and organize in a static spreadsheet. By the time this process is complete, the data has already become outdated and the cycle begins again.

Answering Solar Service Questions
This challenge of parsing through multiple data sources and having data being unreliable, outdated, or altogether missing, means that your solar service team will have a difficult time answering important questions such as:
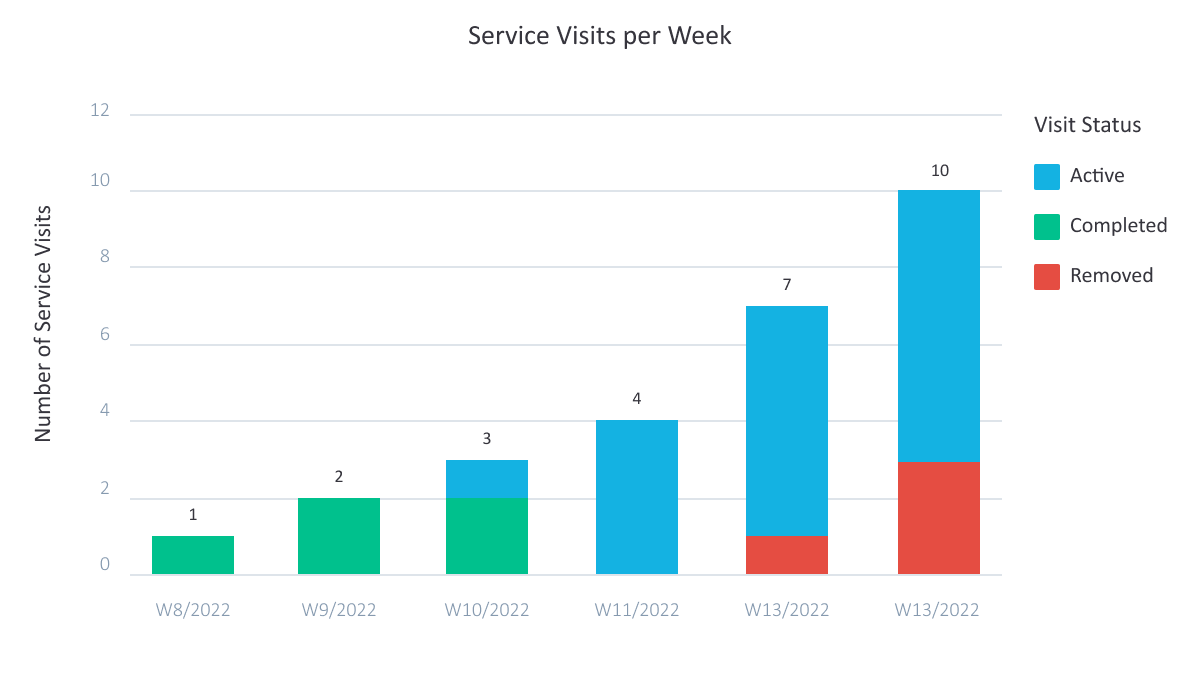
- How many service visits are being completed by my team per week, month, or quarter?
- How can I easily see data aggregated across all service requests?
- What is the ratio of service visits covered under warranty?
- What is the number of service visits requiring parts replacement?
- Which parts are being replaced the most often?
- What is the average time per service visit for my crew? How is it trending?
- Where can I see a queue of my scheduled versus unscheduled service visits?
- How can I assess the effectiveness of my resourcing and see which technicians I have scheduled across different dates?
Not only is this a challenge across solar field service software, but entire businesses. For instance, sales teams must have access to deal and pipeline data and installation teams need an accurate understanding of material requirements.
The Solution: LOOXY Analytics
An Integrated Platform
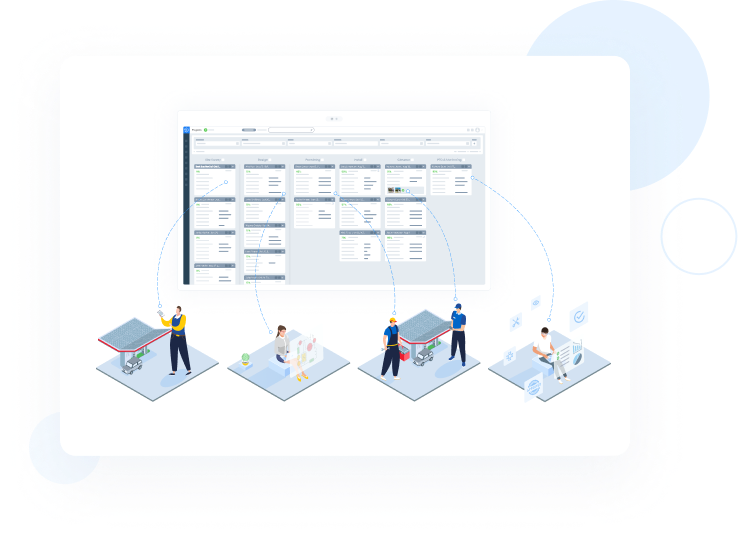
Because of its native integration with the Scoop® platform, LOOXY Analytics is tied directly to your solar service execution data which allows you to build connected, automated, and real-time management dashboards to answer questions across your team.
Default & Custom Reports
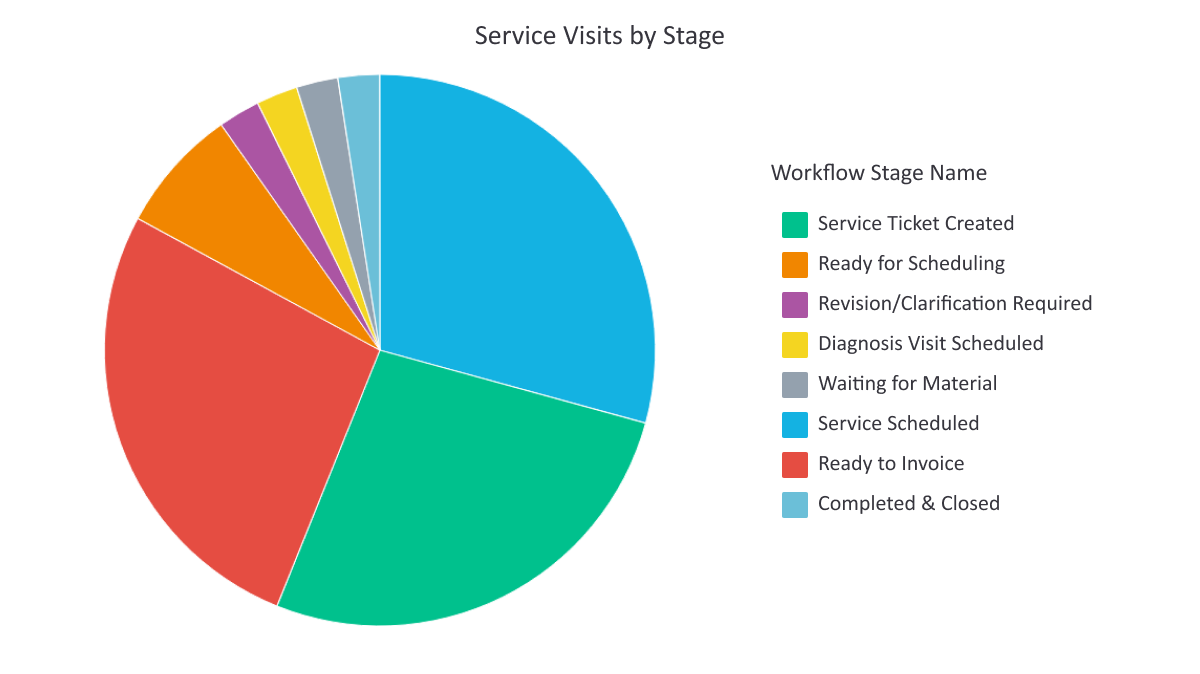
LOOXY provides you with default reports that are focused on key, high level metrics, as well as the ability to create reports using custom data that is unique to you and your business. Service teams can use solar field service reporting software to get at-a-glance answers to how many service visits are being completed in a given time period and the breakdown of these visits by duration, warranty coverage, region, and more.

Drag and Drop Interface
The user-friendly design makes it easy to drag and drop various types of operational data including numeric, dates, and multiple choice values. The intuitive layout allows you to quickly configure dashboards with detailed analytic reports on the status and progression of service visits.
Advanced Data Filtering
LOOXY gives you full control over the visualization of your data. Slice and filter your field service reports to hone in on the most relevant metrics. Examine a variety of data categories including projects, work orders, tasks, and sites and choose how to display your data, whether bar graphs, pie charts, heat and geo maps, and more.

Export & Share Reports
Once your reports and dashboards have been created, you can easily share them with your team or other stakeholders. Export reports as PDF documents or configure automated emails to increase visibility and accountability across your organization.
To reduce costs, save time, and increase capacity to grow your business, solar service teams require an overview of all service visits, as well as the ability to zoom in and review granular details such as resourcing, time per visit, warranty coverage, region, site, and more. Solar service reporting software such as LOOXY provides data that updates automatically in real-time and empowers renewable leaders and executives to stay connected to their operations. For more information on how LOOXY is enhancing solar field service teams, connect with us today.


