The solar energy industry is growing at a compound annual growth rate (CAGR) of 20.9% from 2020 to 2027. This growth means that now, more than ever, solar sales teams need to have strong processes in place that are optimized for growth and efficiency.
Everything from acquiring leads, collecting customer and system information, tracking deal progress, and feeding this information downstream to other teams must be seamless in order to keep busy solar sales teams on track.
Throughout the solar sales cycle, different tools may be used – a CRM to manage leads and contacts, emailing and texting to communicate with those leads as well as customers, a solar design and digital proposal tool for contracts, accounting software to manage invoicing and payments, and the list goes on. With customer data dispersed over so many platforms, it can be challenging for organizations to obtain actionable insights.
Many fast-growing solar installers and service providers are experiencing the setbacks of disconnected solar tools that are not conducive to building a scalable solar sales solution.
While there is no “one size fits all” tool, a best-in-class mPMA platform such as Scoop® Solar scales with your company and helps connect and coordinate solar sales and operations across the other essential tools you use along the way. Because it acts as a central hub, such an mPMA tool also helps you centralize a wealth of operational data in one place – data that is crucial in understanding specific gaps or areas of opportunity in your processes across your solar sales team.
That’s where LOOXY comes in.
LOOXY™ Analytics by Scoop is a new and advanced business intelligence (BI) and analytics platform built atop the Scoop mPMA platform that presents your solar sales and project data in a way that is useful for making more informed business decisions. Its unique pricing model includes unlimited users and dashboards, allowing each user to drilldown on the data that is most relevant to them. These dashboards are helpful in both informing and engaging today’s often remote and multi-organizational team members and cultivating a healthy environment of teamwork, performance, and achievement.
The Challenge
In order to notice patterns or inconsistencies across your organization, your data must be integrated and up-to-date. Unfortunately, it is not uncommon for data to be hosted across individual platforms so when it comes time to assemble reporting, it can be a painstakingly manual process that involves several accounts and static spreadsheets. Even if you are able to consolidate your data, it may be in different formats that do not paint a bigger picture. By the time these reports have been shared or presented, the data is already out-of-date and the process starts again.
If your solar sales team is relying on dashboards and reports that are outdated or incorrect, this can have an impact on your entire business. For example, if you believe that your sales team is working on a certain number of high-value deals that are all at the end of your solar sales funnel, you might approve additional spend for next quarter. However, if it turns out that several of these deals have been lost, pushed to next quarter, or were duplicates of one another, this can have expensive consequences.
This challenge of having multiple data types and sources, and data being unreliable, outdated, or altogether missing, means that your solar sales team will have a difficult time answering important questions such as:
- What is my sales team or external sales partners currently working on?
- How many deals are currently being worked by my sales reps?
- What stage are the various deals at?
- What is the value of these deals?
- How long have they been at the various stages along the funnel?
- Is there an easier way to consolidate data and calculate monthly commission reports for sales reps?
- How can I more easily provide reporting to my sales reps on how many deals they’ve converted over a given time period?
The Solution: LOOXY Solar Sales Analytics
An Integrated Platform
Because of its native integration with the Scoop® platform, LOOXY is tied directly to your solar sales data – including key data from your CRM via a GLOO™ integration – meaning you can build connected, automated, real-time management dashboards to answer questions across your team. This ensures you capture all relevant data and allows your sales team to spend more time making sales and less time maintaining their sales data.
Related: Access the LOOXY Reporting & Analytics Webinar Recording
Default & Custom Reports
LOOXY provides you with the ease of pulling in pre-built reports that are focused on highly relevant industry metrics, as well as the flexibility to create custom reports by leveraging data that is unique to you and your business. These custom reports allow you to better understand high-level trends across your team while simultaneously monitoring granular KPIs.
Drag and Drop Interface
The user-friendly design makes it easy to drag and drop various types of operational data including numeric, dates, and multiple choice values. LOOXY’s intuitive layout means that you can quickly configure dashboards with detailed analytic reports and start monitoring your solar sales metrics and KPIs.
Flexible Data Filtering
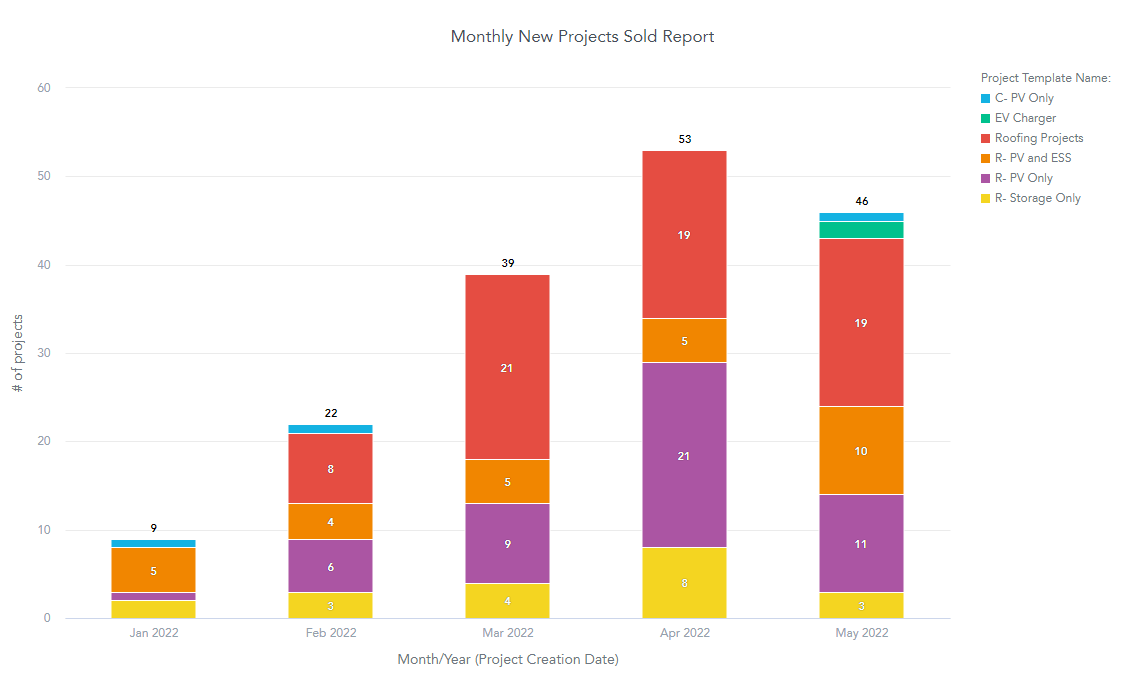
Enjoy flexible filtering options to focus on the most relevant data at any given time and decide how best to display your data. Whether you are looking at the performance of your sales team, your current materials sales pipeline, or a monthly commission report for your sales reps, choose between bar graphs, pie charts, tables, heat or geo maps, and more. LOOXY gives you full control over how your data is visualized.
Export & Share Reports
Once your reports and dashboards have been created, you can easily share them with your team or other stakeholders. Export reports as PDF documents or configure automated emails to increase visibility and accountability across your organization.
There is a variety of important data for sales teams to review and without the proper tools in place, this data can quickly become scattered, outdated, and fail to paint a clear picture. The LOOXY Reporting & Analytics Platform is empowering Renewable Leaders and Executives to stay connected to your operations through real-time reports and dashboards, whether in sales, service, or installation teams. For more information on how LOOXY can provide insight to you and the specific challenges of your solar sales team, connect with us today.