


“Scoop is something that we knew that we wanted to move to immediately. We knew it was going to be able to help us manage all of our projects across the board.”


“Scoop was the only thing that had the capability of doing what it does. We could use other tools and update customers but it's not the same.”


“When I open Scoop, I'm getting a bird's eye view of all of the projects in progress. It has everything right there.”


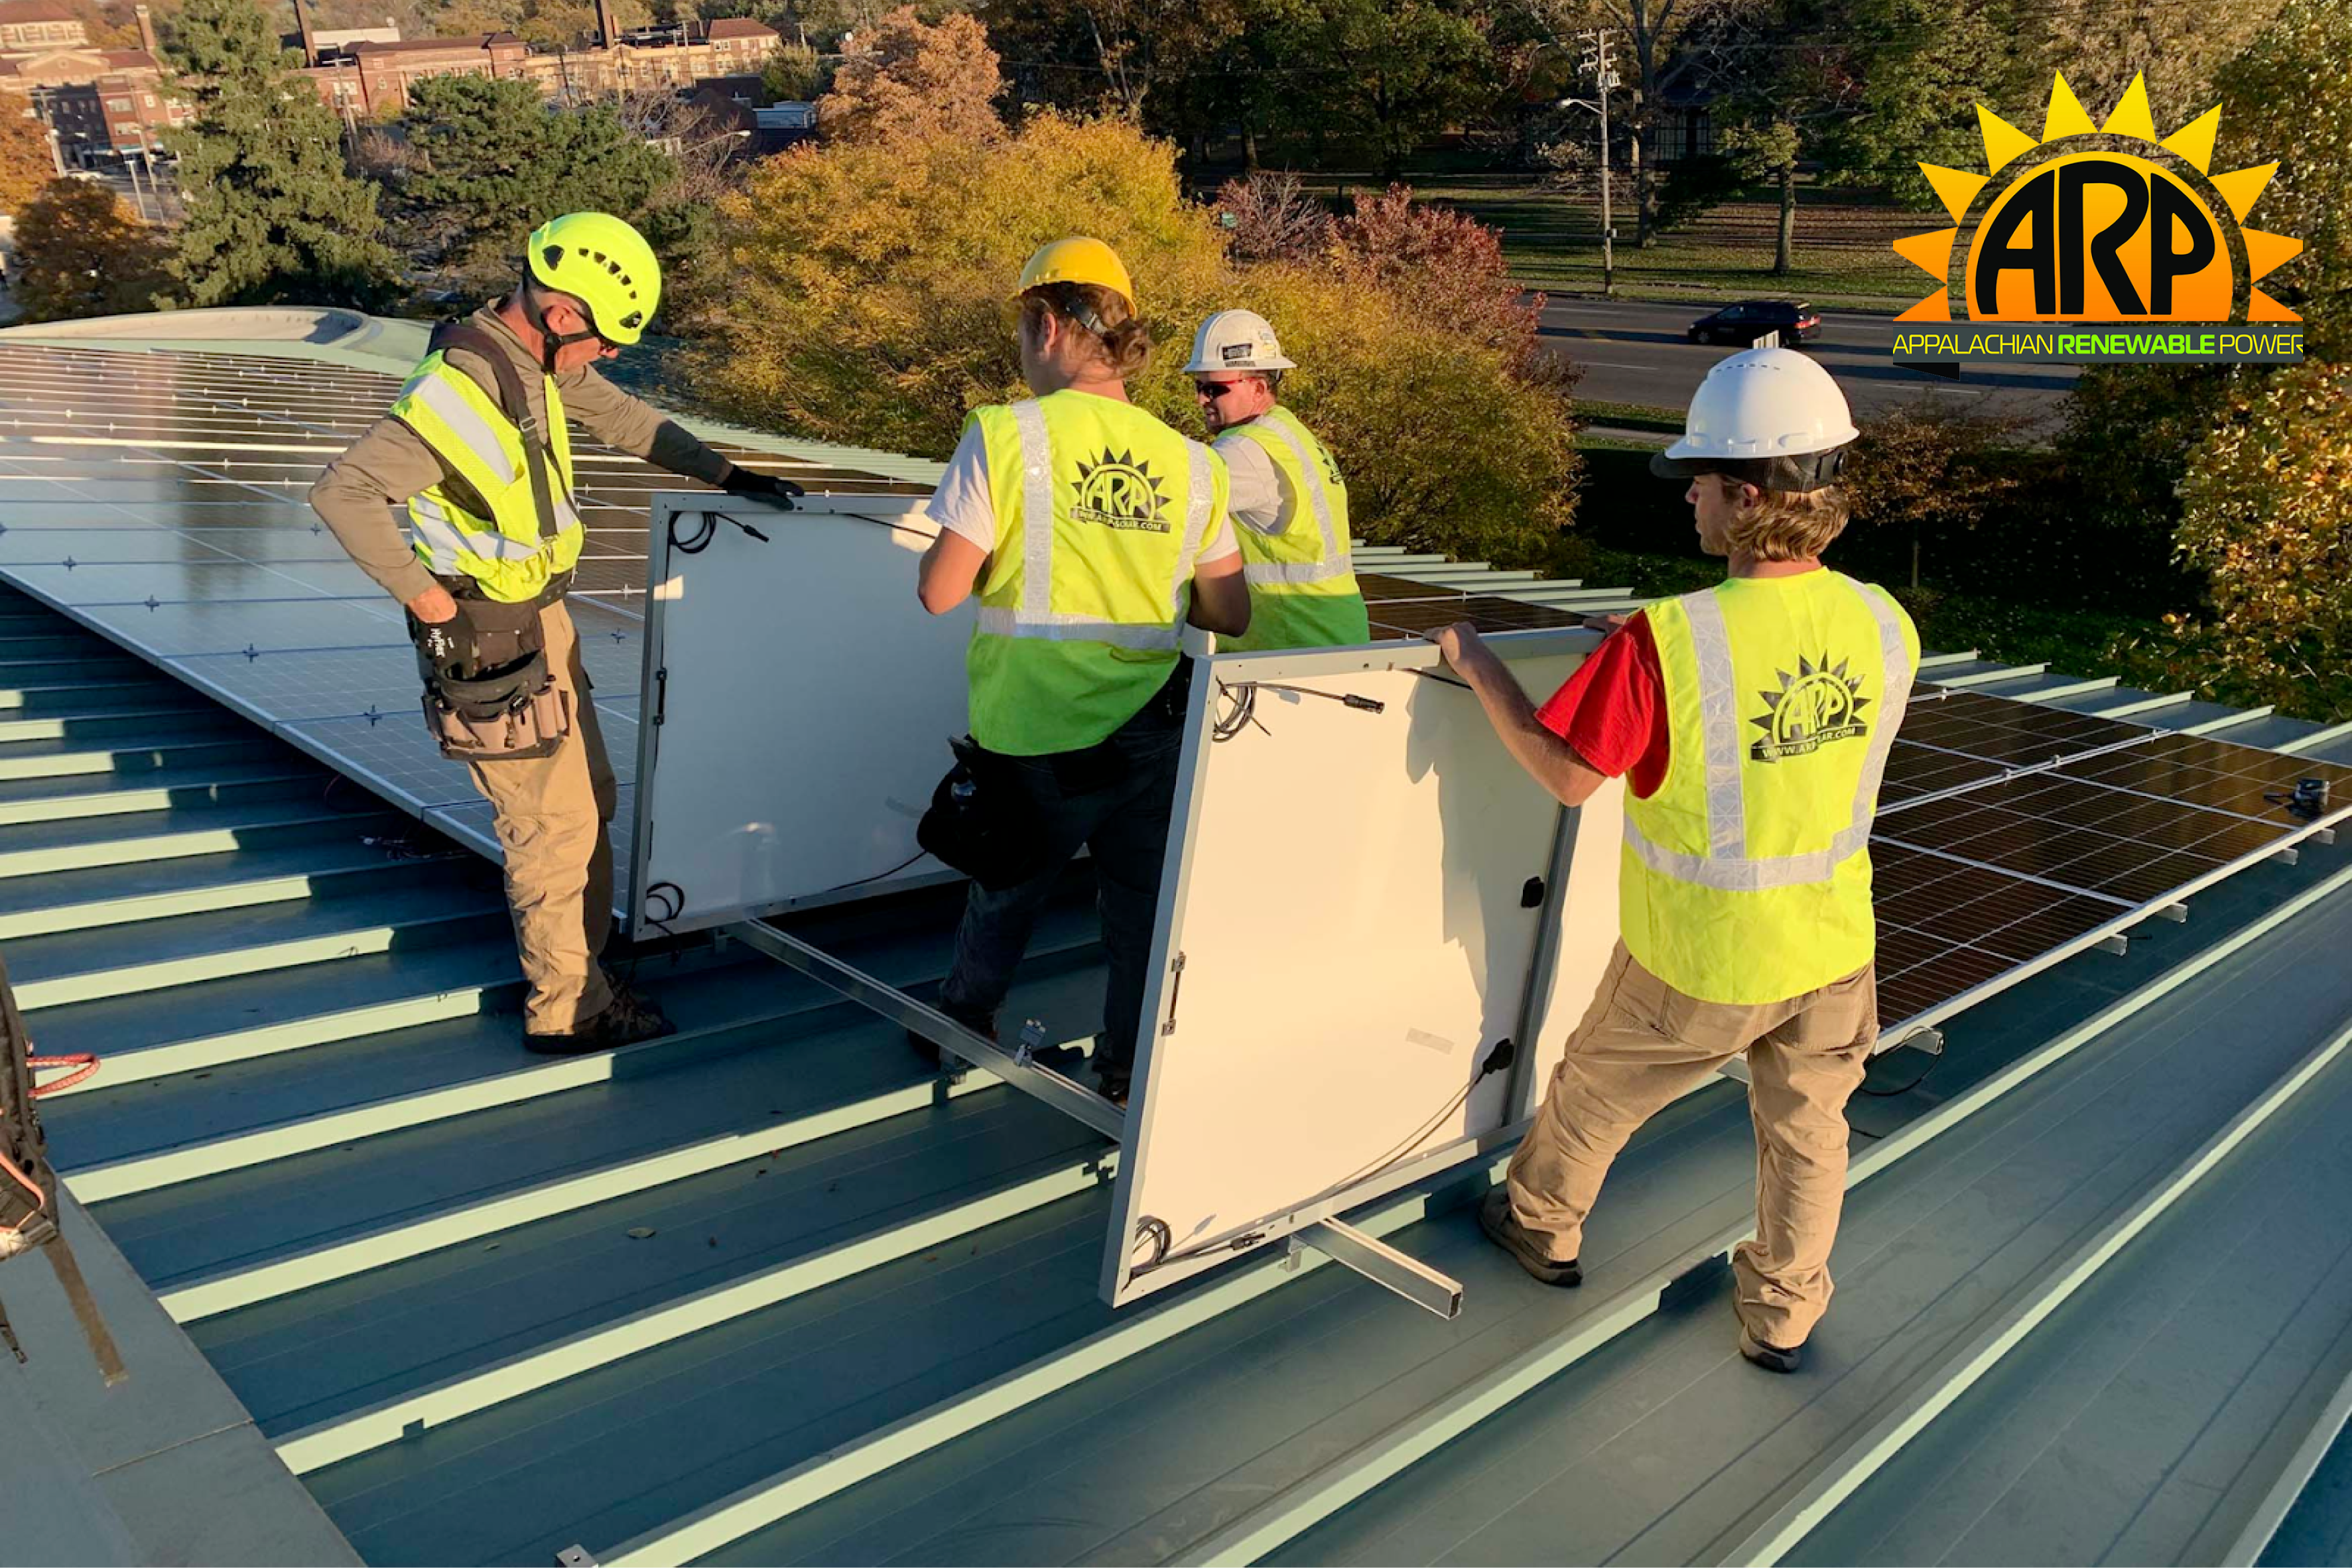
Case Study: How ARP Solar Future-Proofed Their Business With Scoop
ARP Solar, a seasoned player with 15 years in the industry, is a leading force in residential and commercial installations
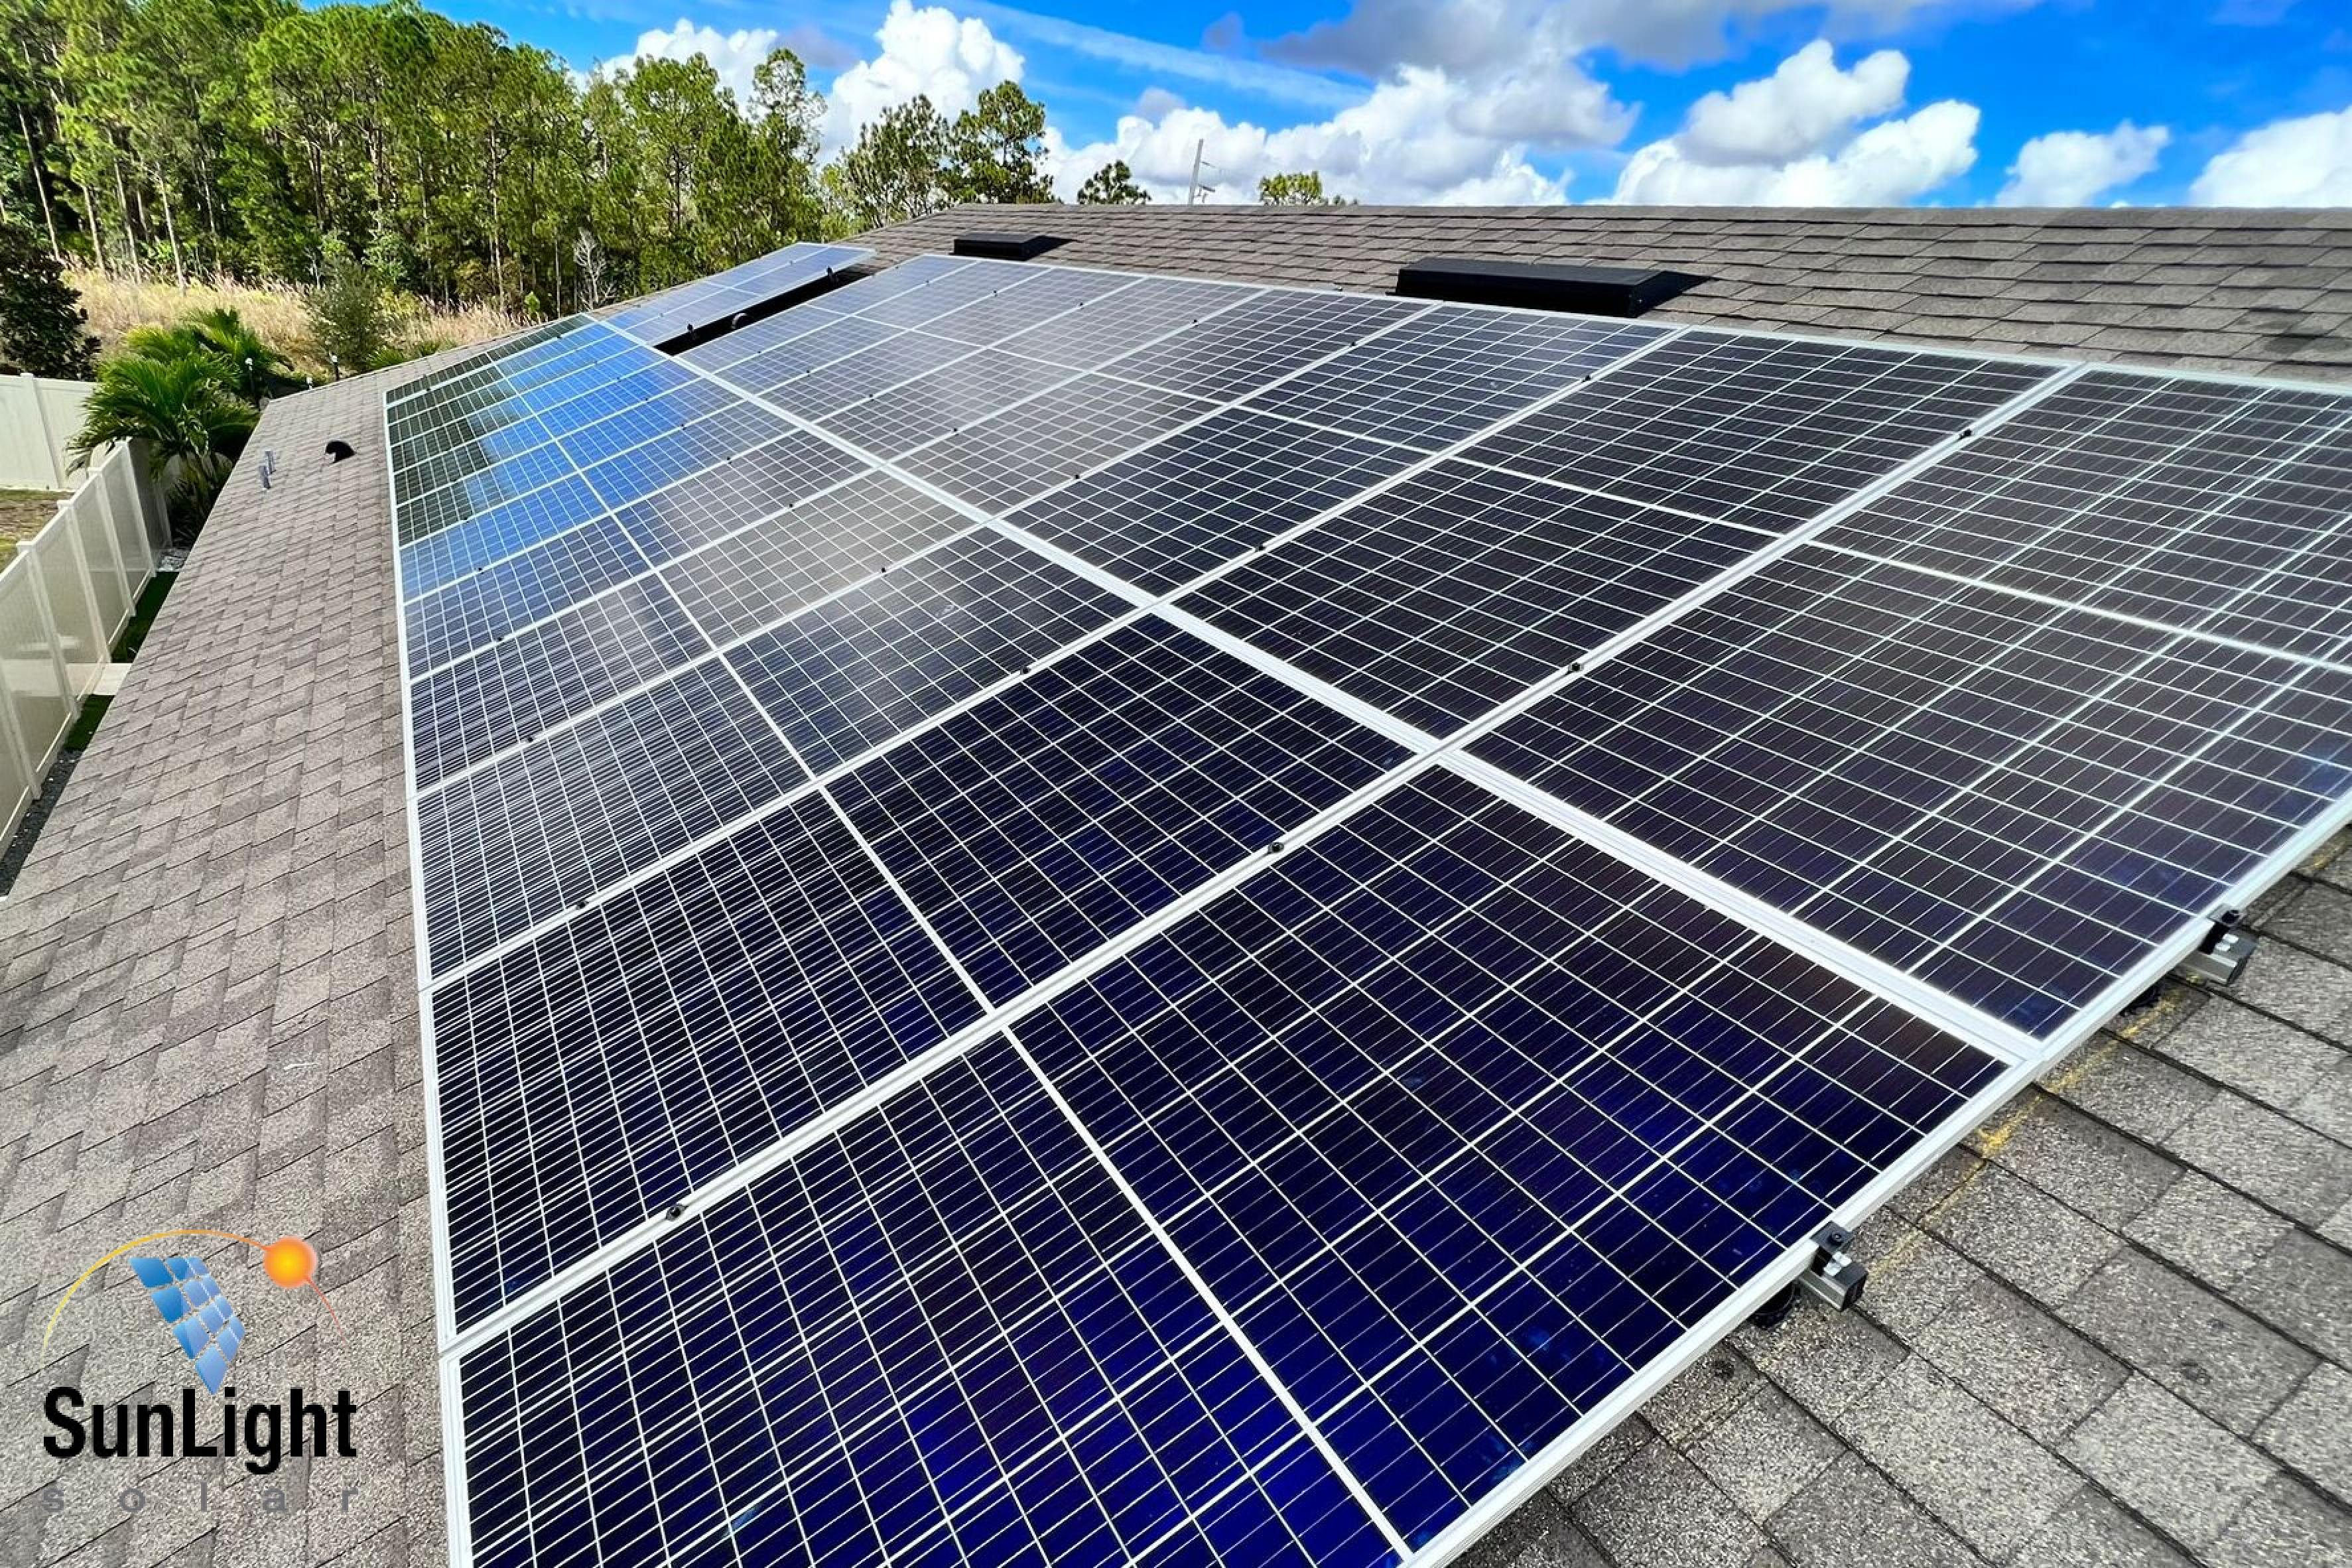
Case Study: How Sunlight Solar Scaled Operations by 500% With Scoop
Sunlight Solar is a Florida-based family-owned business providing solar and battery storage solutions for both residential and commercial customers. They
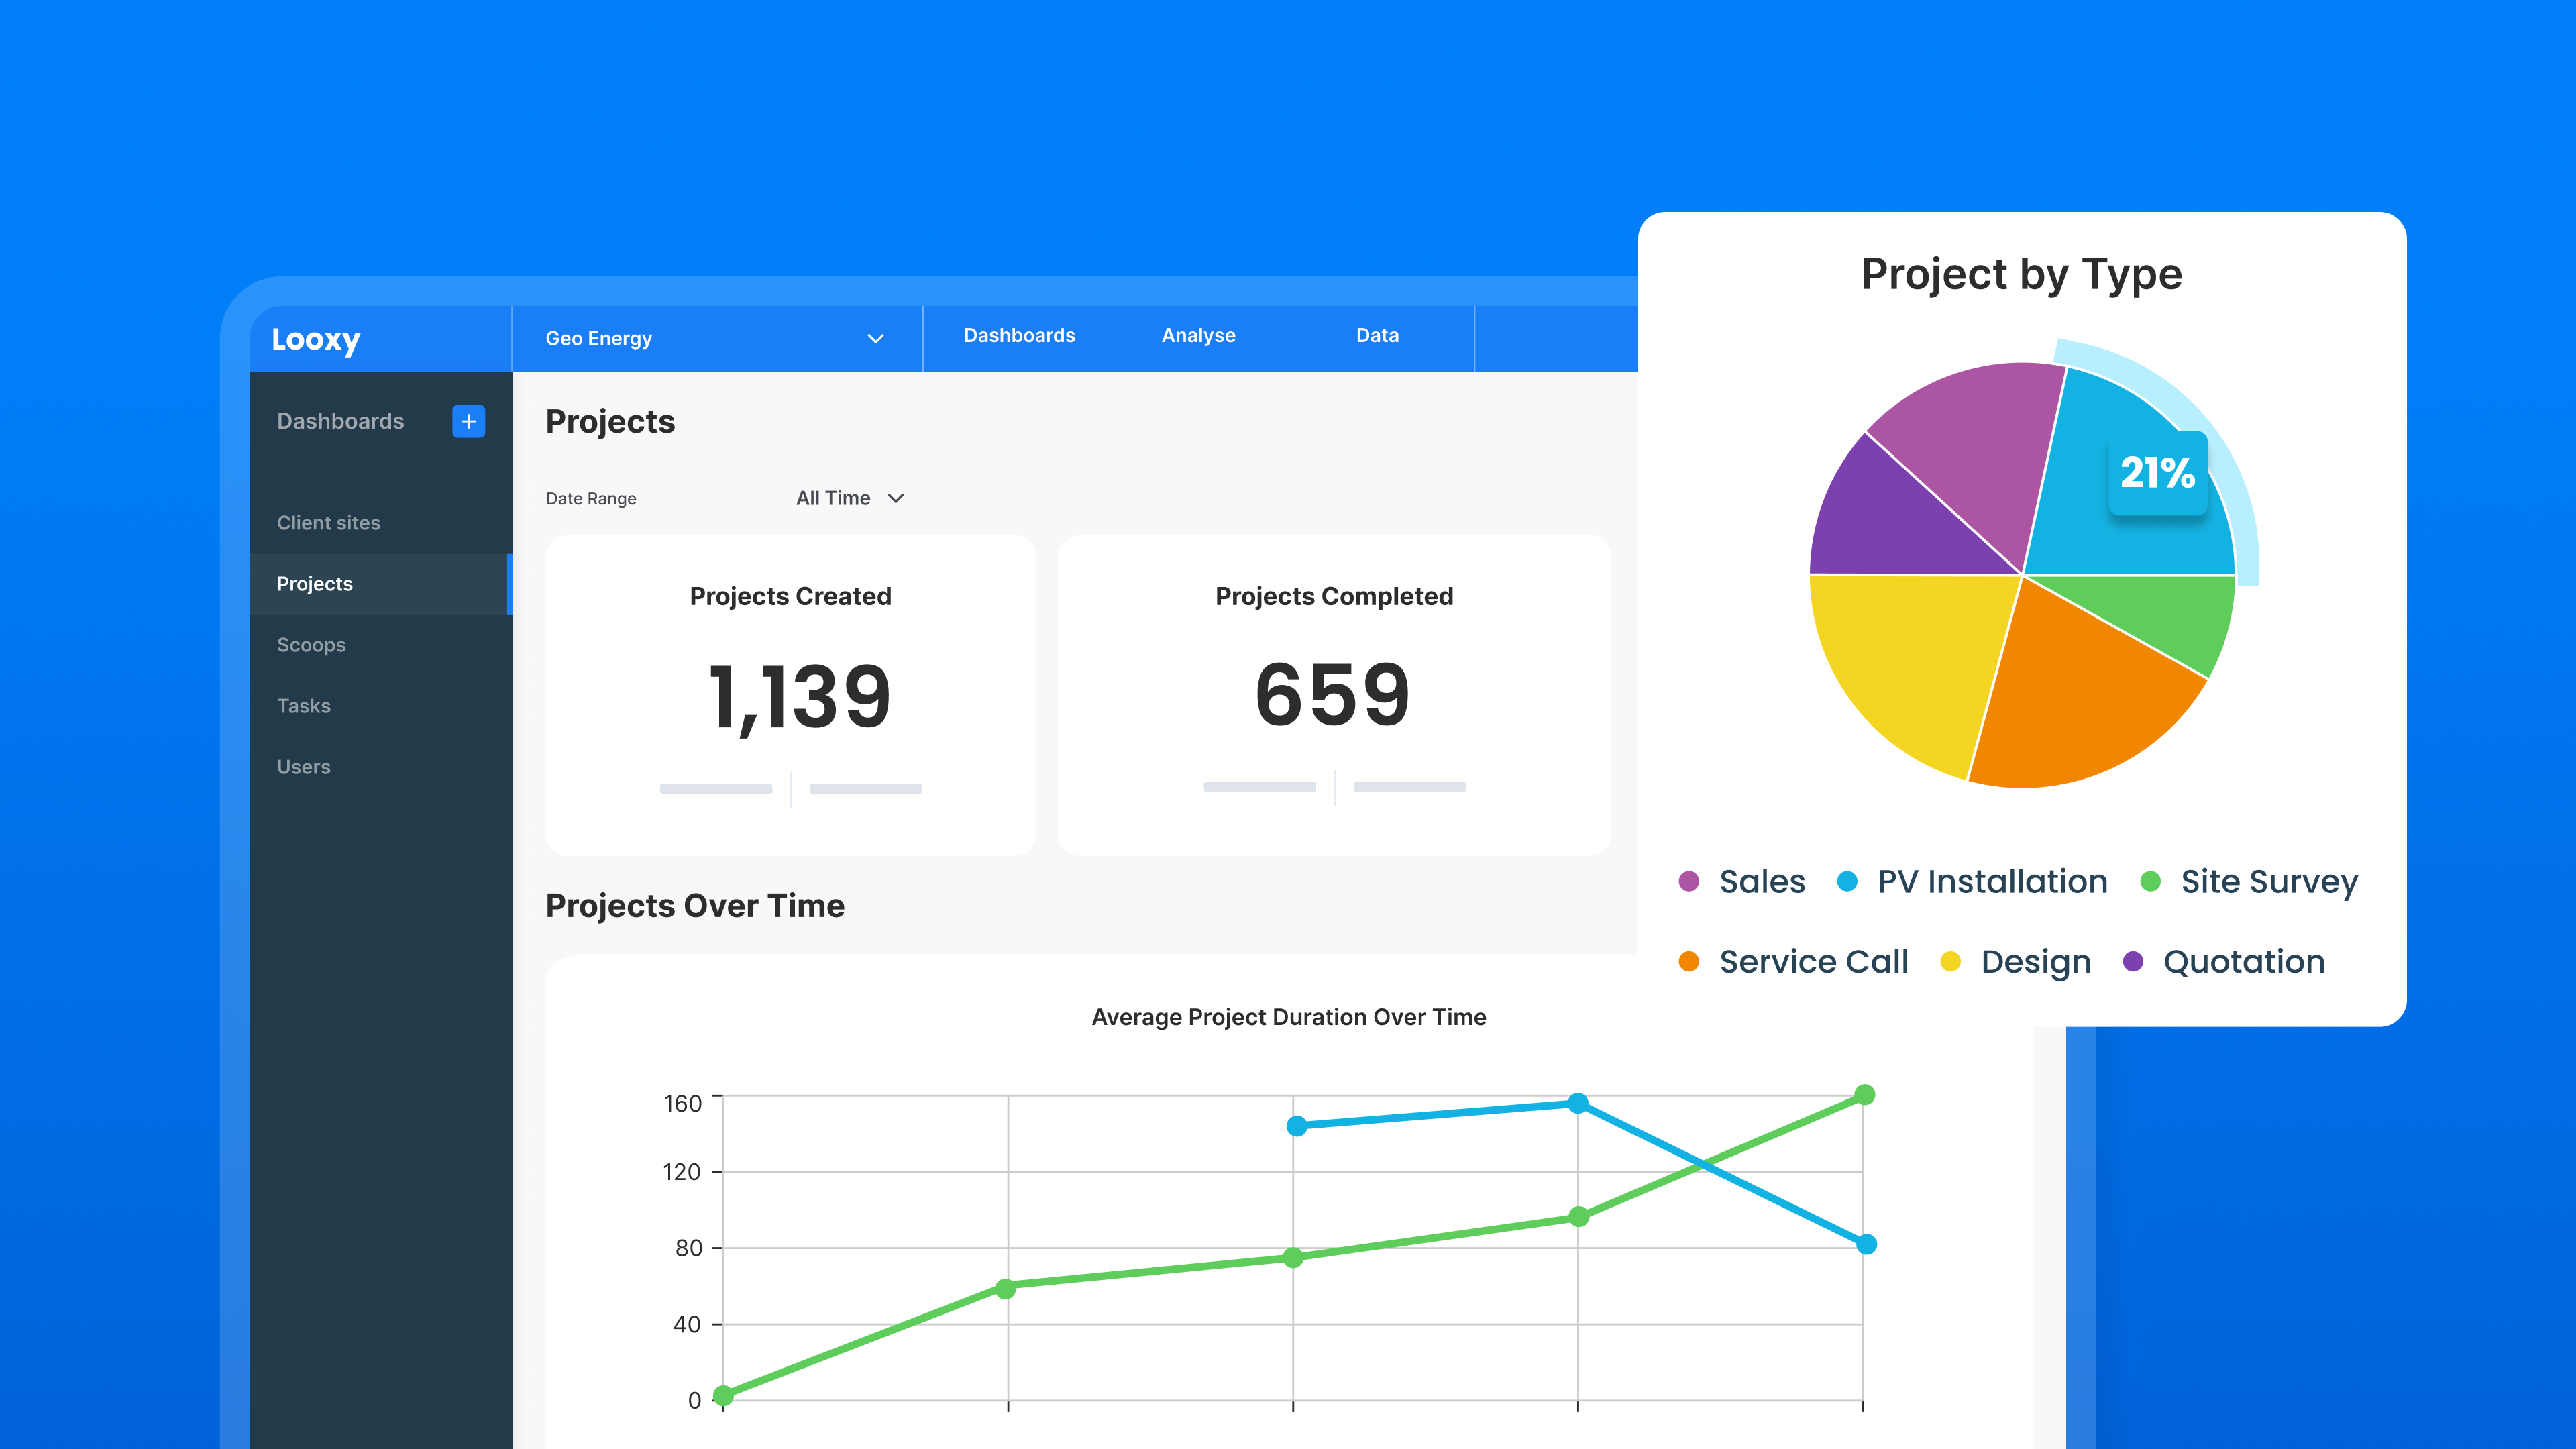
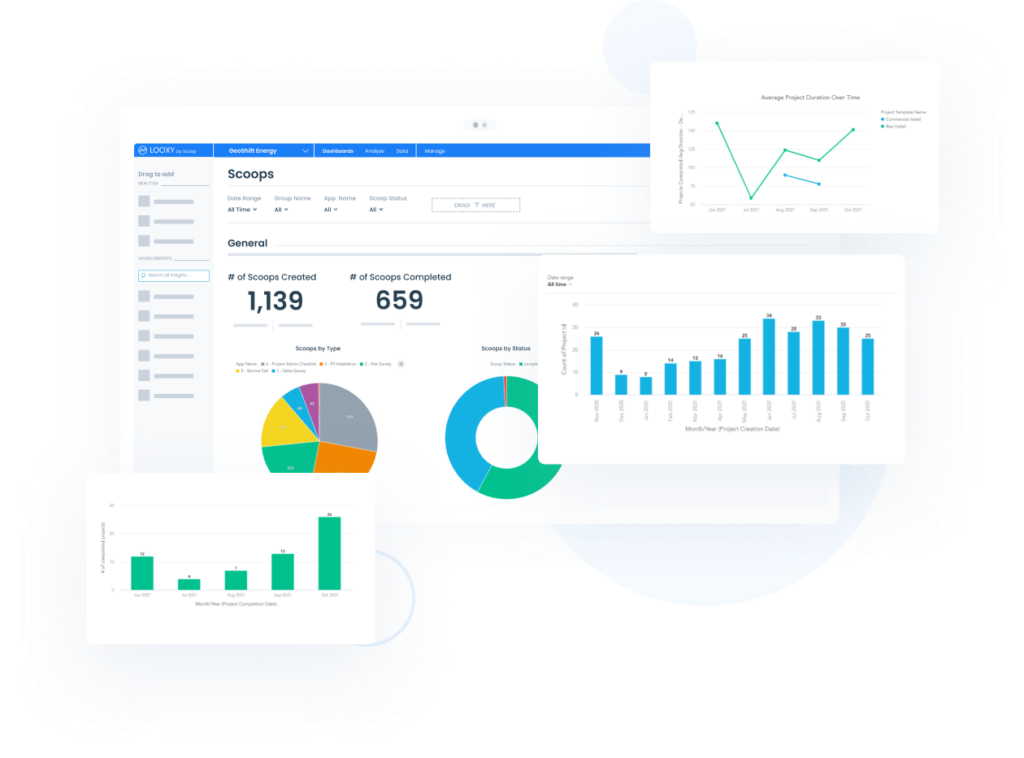
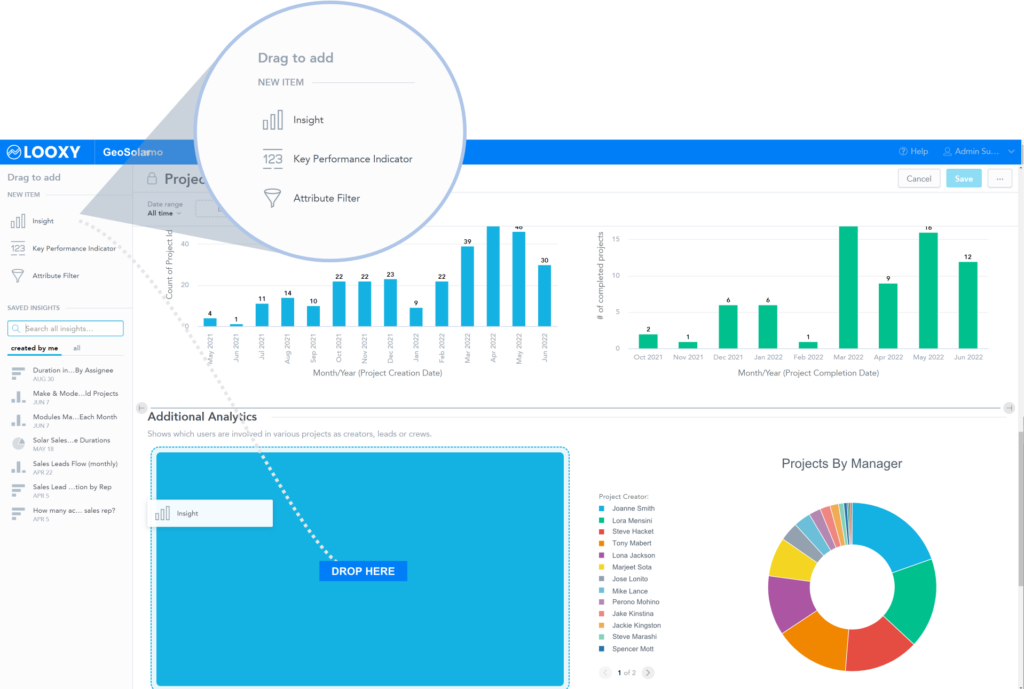
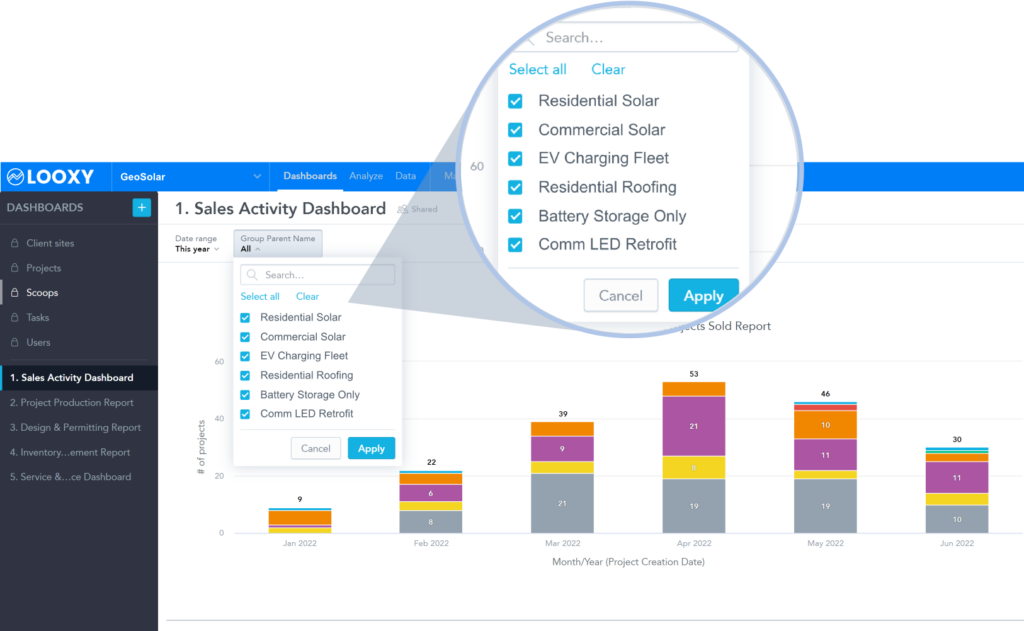
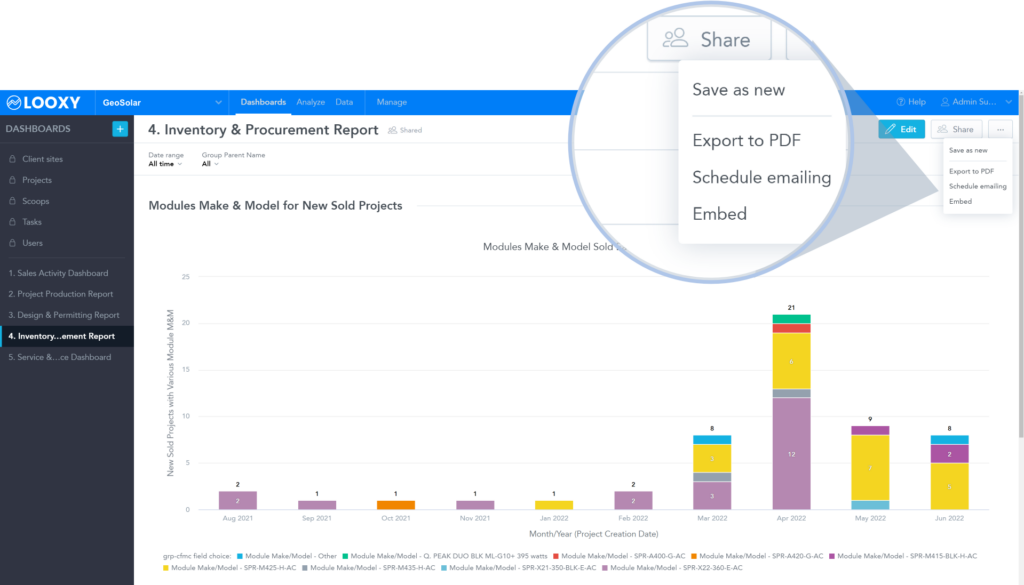
Renewable Energy Project Tracking Analytics: Why Choose Scoop
Regardless of the industry you work in, project analytics can be a game changer to the way you conduct business.