Regardless of the industry you work in, project analytics can be a game changer to the way you conduct business. Everything from project status reports to budget forecasts, sales data, and historical performance reports can help you understand what you are doing well and identify areas of opportunities. In a nutshell, project tracking analytics help teams make more informed business decisions.
“Reports are essential tools in business. They play a crucial role in the startup, ongoing, growth, expansion, and even survival stages of a company.”
Best in Class Analytics for Renewable Energy Operations Management
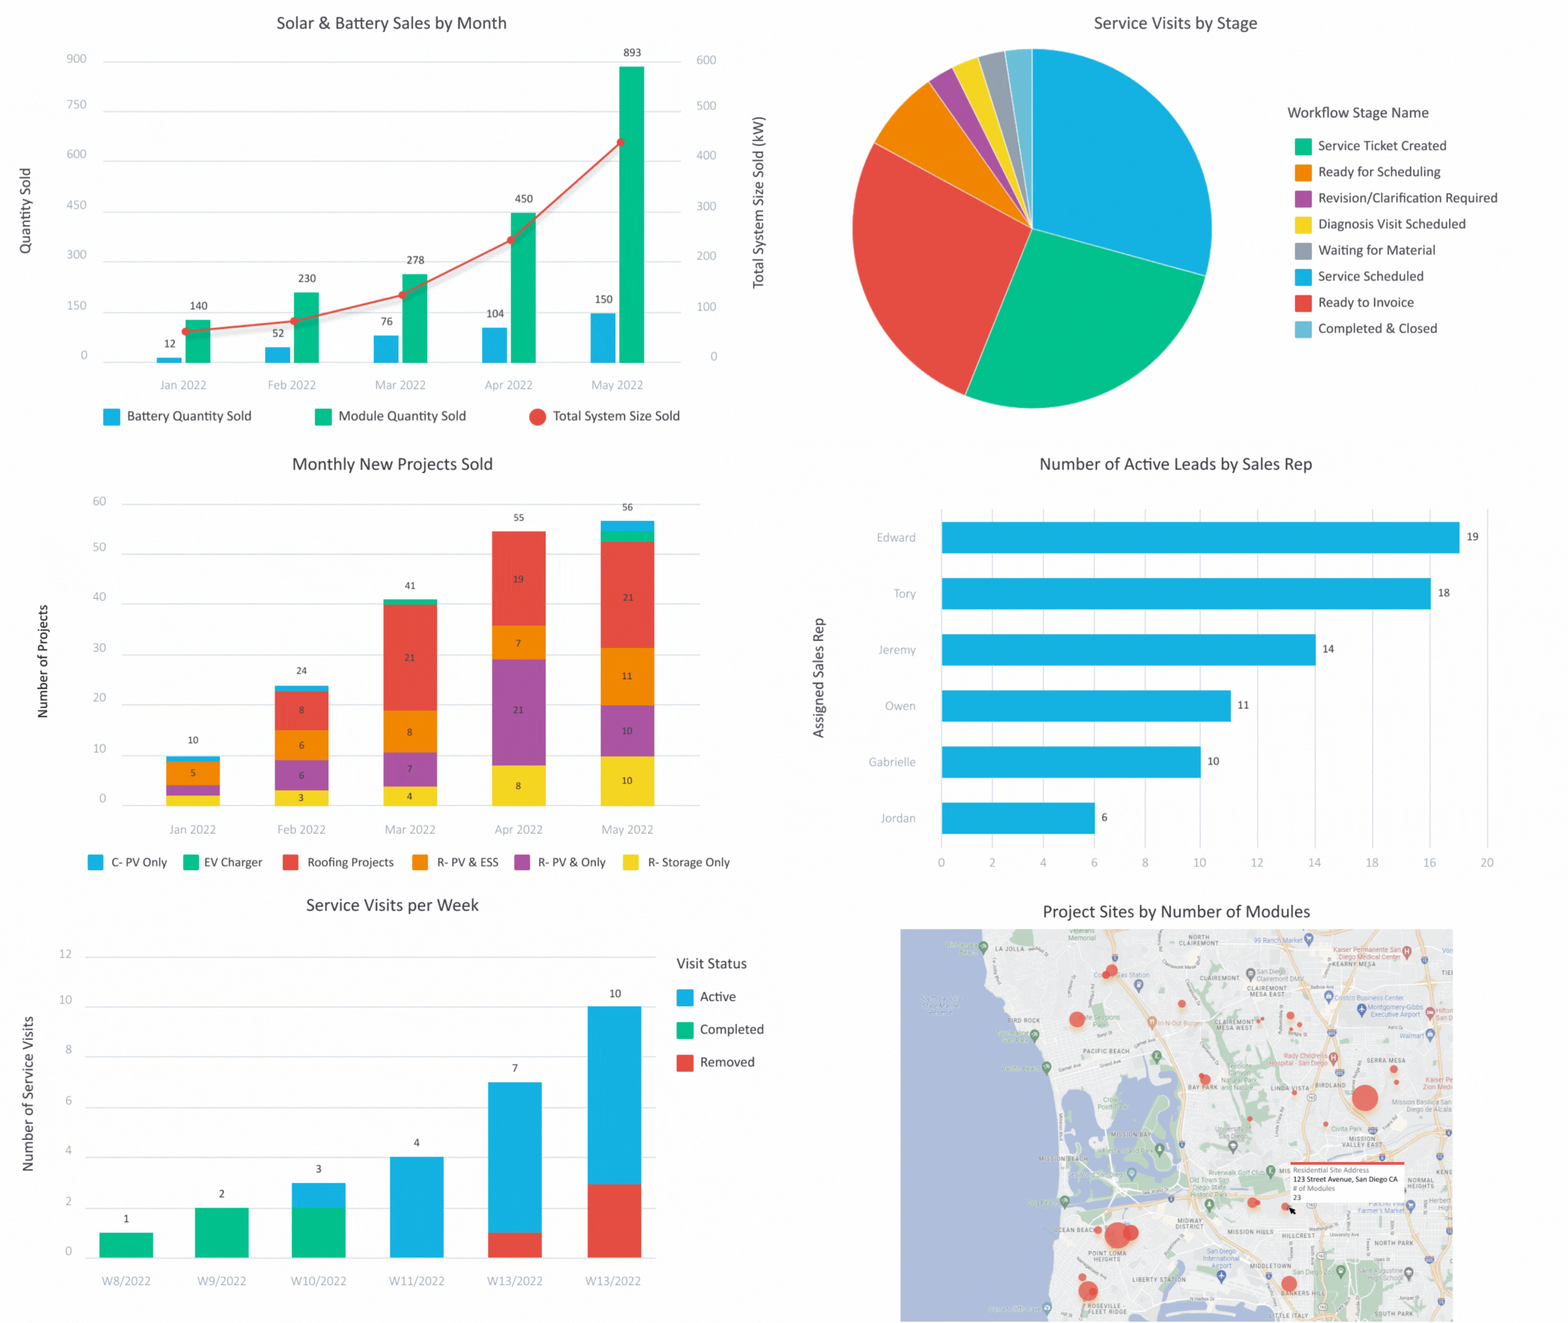
When it comes specifically to the renewable energy sector, LOOXY™ by Scoop offers best-in-class reporting and analytics. What distinguishes LOOXY from other reporting or business intelligence tools is that it was designed with field operations in mind. In this way, the reports surface data that is relevant to your business, projects, and processes. The platform comes with an intuitive drag-and-drop dashboard builder and unlimited reports, allowing your team to focus on the data that is most relevant to them, collect actionable insights, and make more informed decisions.
Integrated Project Analytics
LOOXY is seamlessly integrated with the Scoop® platform, providing you with complete accessibility and authority over your data. This native integration allows renewable teams to surpass the constraints imposed by other analytics tools. With synchronized operations data, you can eliminate the risk of missing or outdated data. In order to keep up-to-date, you no longer need to go through the hassle of manual uploads. LOOXY updates in real-time, ensuring your reports reflect the current status of ongoing renewable and solar projects.
Focus on Relevant Data
With LOOXY, you can easily sort and filter your operations and project data to hone in on the most relevant data. Your team can monitor a variety of data categories including projects, work orders, tasks, and job sites, giving you full control over your data visualization.
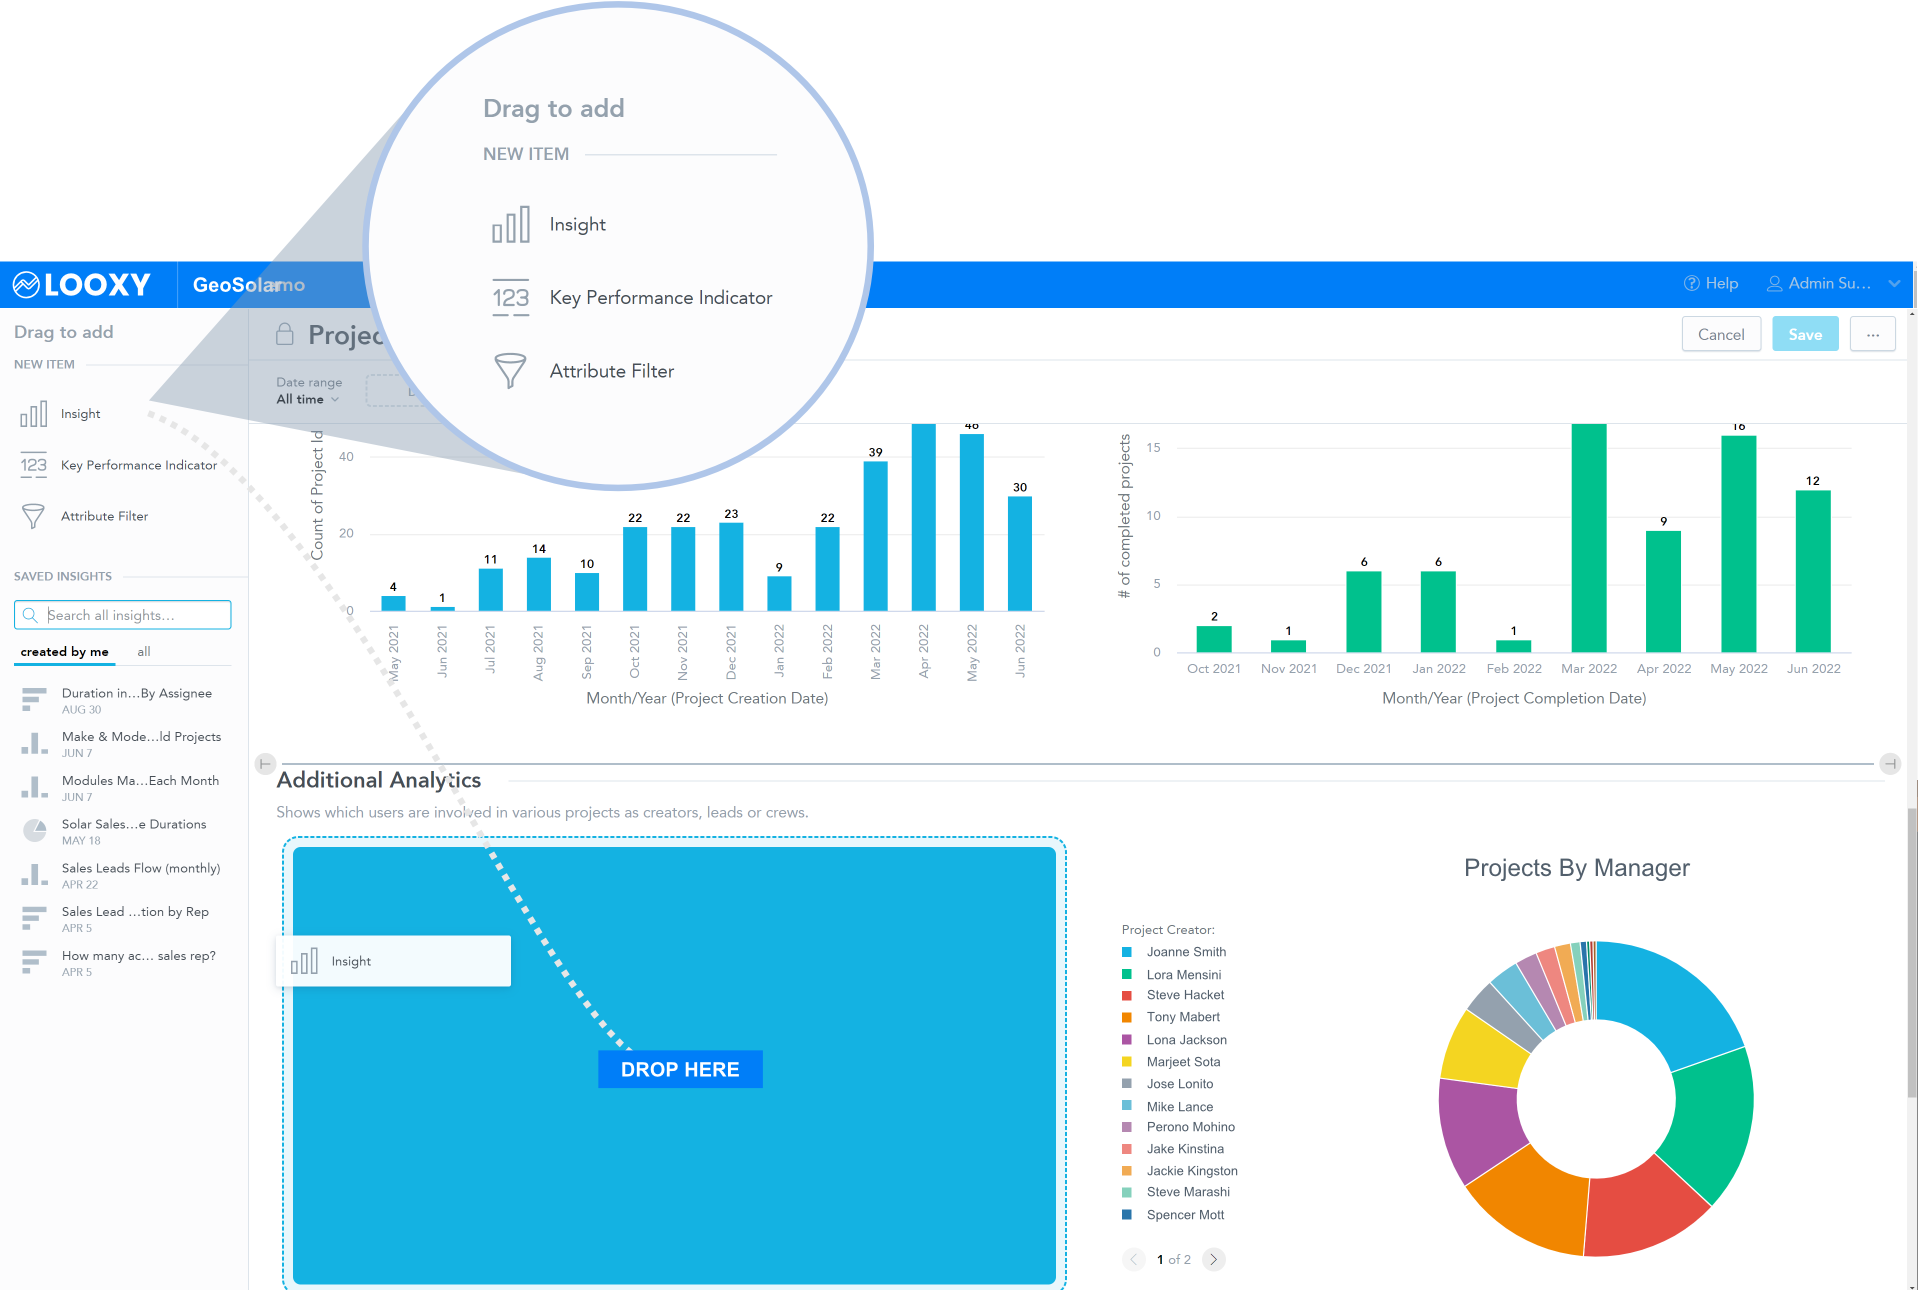
Drag and Drop Report Builder
The drag and drop interface is intuitive and allows you to add custom or pre-built reports. Within each dashboard, users can add multiple sections, charts, and key performance indicators (KPIs). Because each company’s operations are unique, LOOXY provides a variety of reports – from bar graphs and pie charts to heat and geo maps, trendlines, tables, and more.
Export and Share Reports
Create an unlimited number of dashboards and reports to download and share across your team or with other stakeholders. Export reports as PDF documents to send or better yet, configure automated emails that are triggered based on specific criteria to notify employees across your company and provide them with a PDF as well as a link to the dashboard in LOOXY.
Related: 3 Dashboards Every Solar Executive Needs
Keeping Solar Energy Projects on Track
In addition to the LOOXY solution, the Scoop platform offers native features that make project tracking analytics intuitive and insightful for renewable energy companies. Scoop’s Project Tracker Live™ puts your customers and projects front-and-center. The dashboard makes it easy for your team to access reliable project status and insights across your entire portfolio. This connected and automated system provides a quick overview of project progress as well as the ability to double-click and view specific project details.
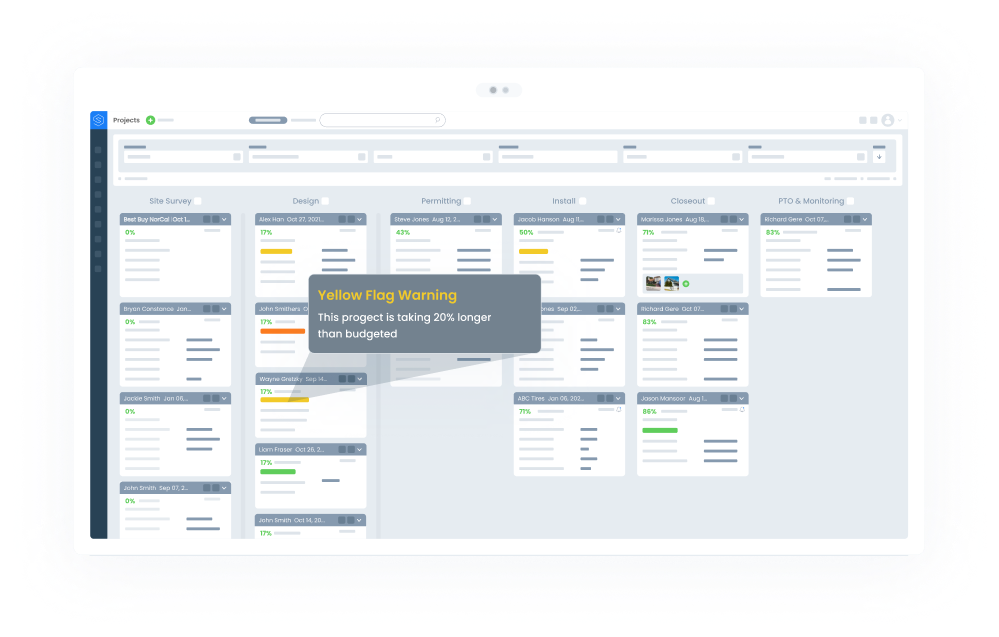
Another powerful feature that is used in tandem with the Project Tracker dashboard is Scoop’s Project Performance Analytics, which measures the performance of each project and its individual phases. Using sophisticated analysis, this feature compares your live project duration to both budgeted and historical durations, flagging underperforming projects with color-coded flags for further review. Project Performance Analytics makes process optimization easy, mitigates risks by identifying them early, and allows your team to manage future as well as ongoing projects.
Renewables Project Management Software
If this is your first time learning about LOOXY or Scoop, you might have some questions. For starters, what is Scoop and why is it relevant to me?
Scoop is the leading solar software that allows renewable leaders to streamline and simplify solar project management, tracking, and reporting. Scoop connects field and office teams, mobilizes work processes, automates project tasks, communication, and follow-ups, and so much more.
Real-Time Collaboration with Your Team
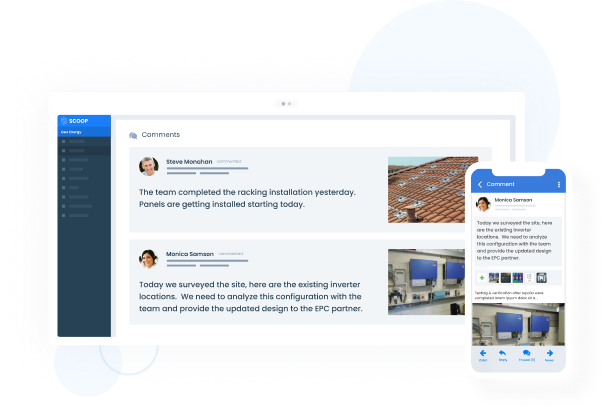
Within Scoop, users can assign tasks and add comments, as well as upload reference photos, videos, and documents. This integrated communication makes it easy for your team to stay up-to-date on projects as they progress and can allow for significant cost savings as your team reduces duplicate and manual data entry, repeat site visits, and project delays.
Accurate Data Anywhere, Any Time
Scoop improves transparency and collaboration across renewable teams. This is in part due to the responsive nature of the platform – Scoop’s cloud-based software works across desktop and mobile, providing field teams with the same access to data, checklists, and documents that office teams have. The mobile app engages technicians and others while on-site, is available for iOS and Android devices, and comes equipped with offline mode to ensure that network interruptions don’t lead to project delays.
Organize Documents and Tasks in One Centralized Platform
Scoop’s Global Fields feature allows you to auto-populate data, media, and documents throughout various project stages, eliminating tedious and duplicate data entry. Smart Forms are another strategic way to organize information, providing project managers, team leads, and platform admins with the ability to add flexible fields such as text, dropdown, numerical, and so on to work orders and project forms.
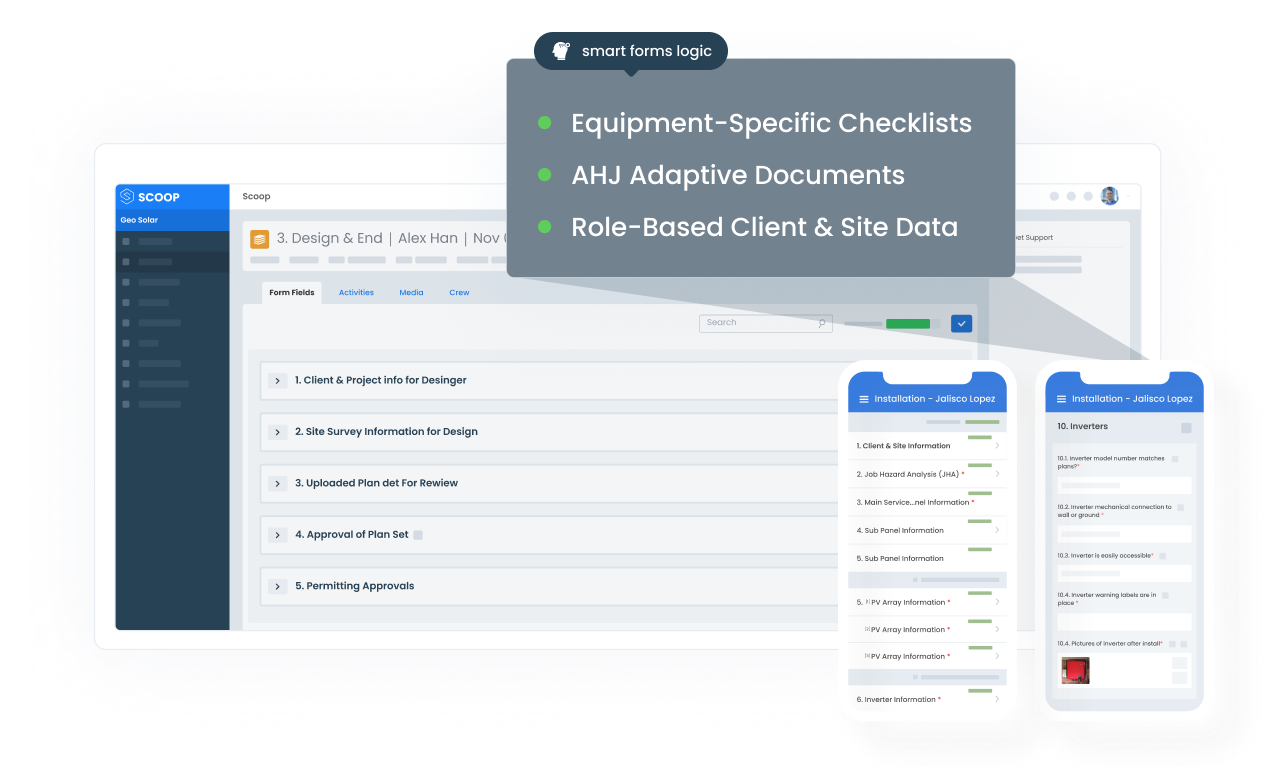
As market conditions evolve and the demand for solar energy increases, leading renewable companies are using Scoop to digitize and automate their solar operations. If your company is looking for support on undergoing a digital transformation, learning more about Scoop’s clients and solutions, or are ready to optimize your processes and make faster decisions through reporting, get in touch with us.
Renewable Project Tracking Analytics FAQs
What is LOOXY used for?
LOOXY is used by Scoop customers to visualize a variety of important solar and renewable energy reports, including sales pipeline reports showing number of projects, kWs and dollar value sold over preceding weeks, months or quarters, construction pipeline visualization showing the number of projects in various phases over preceding periods, identification of phase / workflow stage bottlenecks, service O&M reports visualizing volume of service tickets and time to resolution trends, geographic map of active projects, workload visualization by team member for resource balancing purposes, and much more.
How many projects can you track within LOOXY?
LOOXY comes with unlimited dashboards, meaning you can track and manage all of the projects across your portfolio. By drilling into project data and gathering insights, you can identify ways to increase efficiency, decrease risk, and generate a higher return on investment.
What type of companies fall into the renewables sector?
These companies might include solar power or wind energy companies, EV charging installers, renewable energy O&M or service providers, hydroelectric, geothermal, and biomass businesses.
Can you manage multiple assets within Scoop?
While Scoop is not an asset management tool, Scoop’s GLOO Integration Service is a way for customers to connect software technologies. These integrations can also be beneficial for analysis, allowing users to streamline the reporting process and consolidate data from multiple sources.


