As a solar leader, do you feel your organization’s reporting provides an accurate picture of your business operations or are disconnected and manual spreadsheets something you can relate to? If you do have an automated reporting system, how confident are you that the right metrics and KPIs are being tracked? This article will explore how to generate reports that are tied directly to your operational data, meaning they update automatically and effortlessly, and the three dashboards that every solar executive needs.
The Importance of Real-Time Reporting
Reporting is a crucial part of any business, allowing you to track and better understand performance at a company, team, and individual level. This data presents a history of your activities over time and real-time reports can help you identify both high-performing and high-risk areas. In fact, data-driven companies tend to have increased revenue, better customer service, and highly optimized operations.
Unfortunately, it is not uncommon for renewable energy and other field-based teams to deploy rather manual methods of reporting – perhaps various team members are updating information in static, disconnected spreadsheets. While this approach can work in the short-term, it is not reliable during busy periods or high growth phases. It also means that either your team is spending enormous amounts of time updating data when they could be focused on other tasks, or that more often than not, your reports are outdated.
Creating Intuitive Dashboards with Scoop
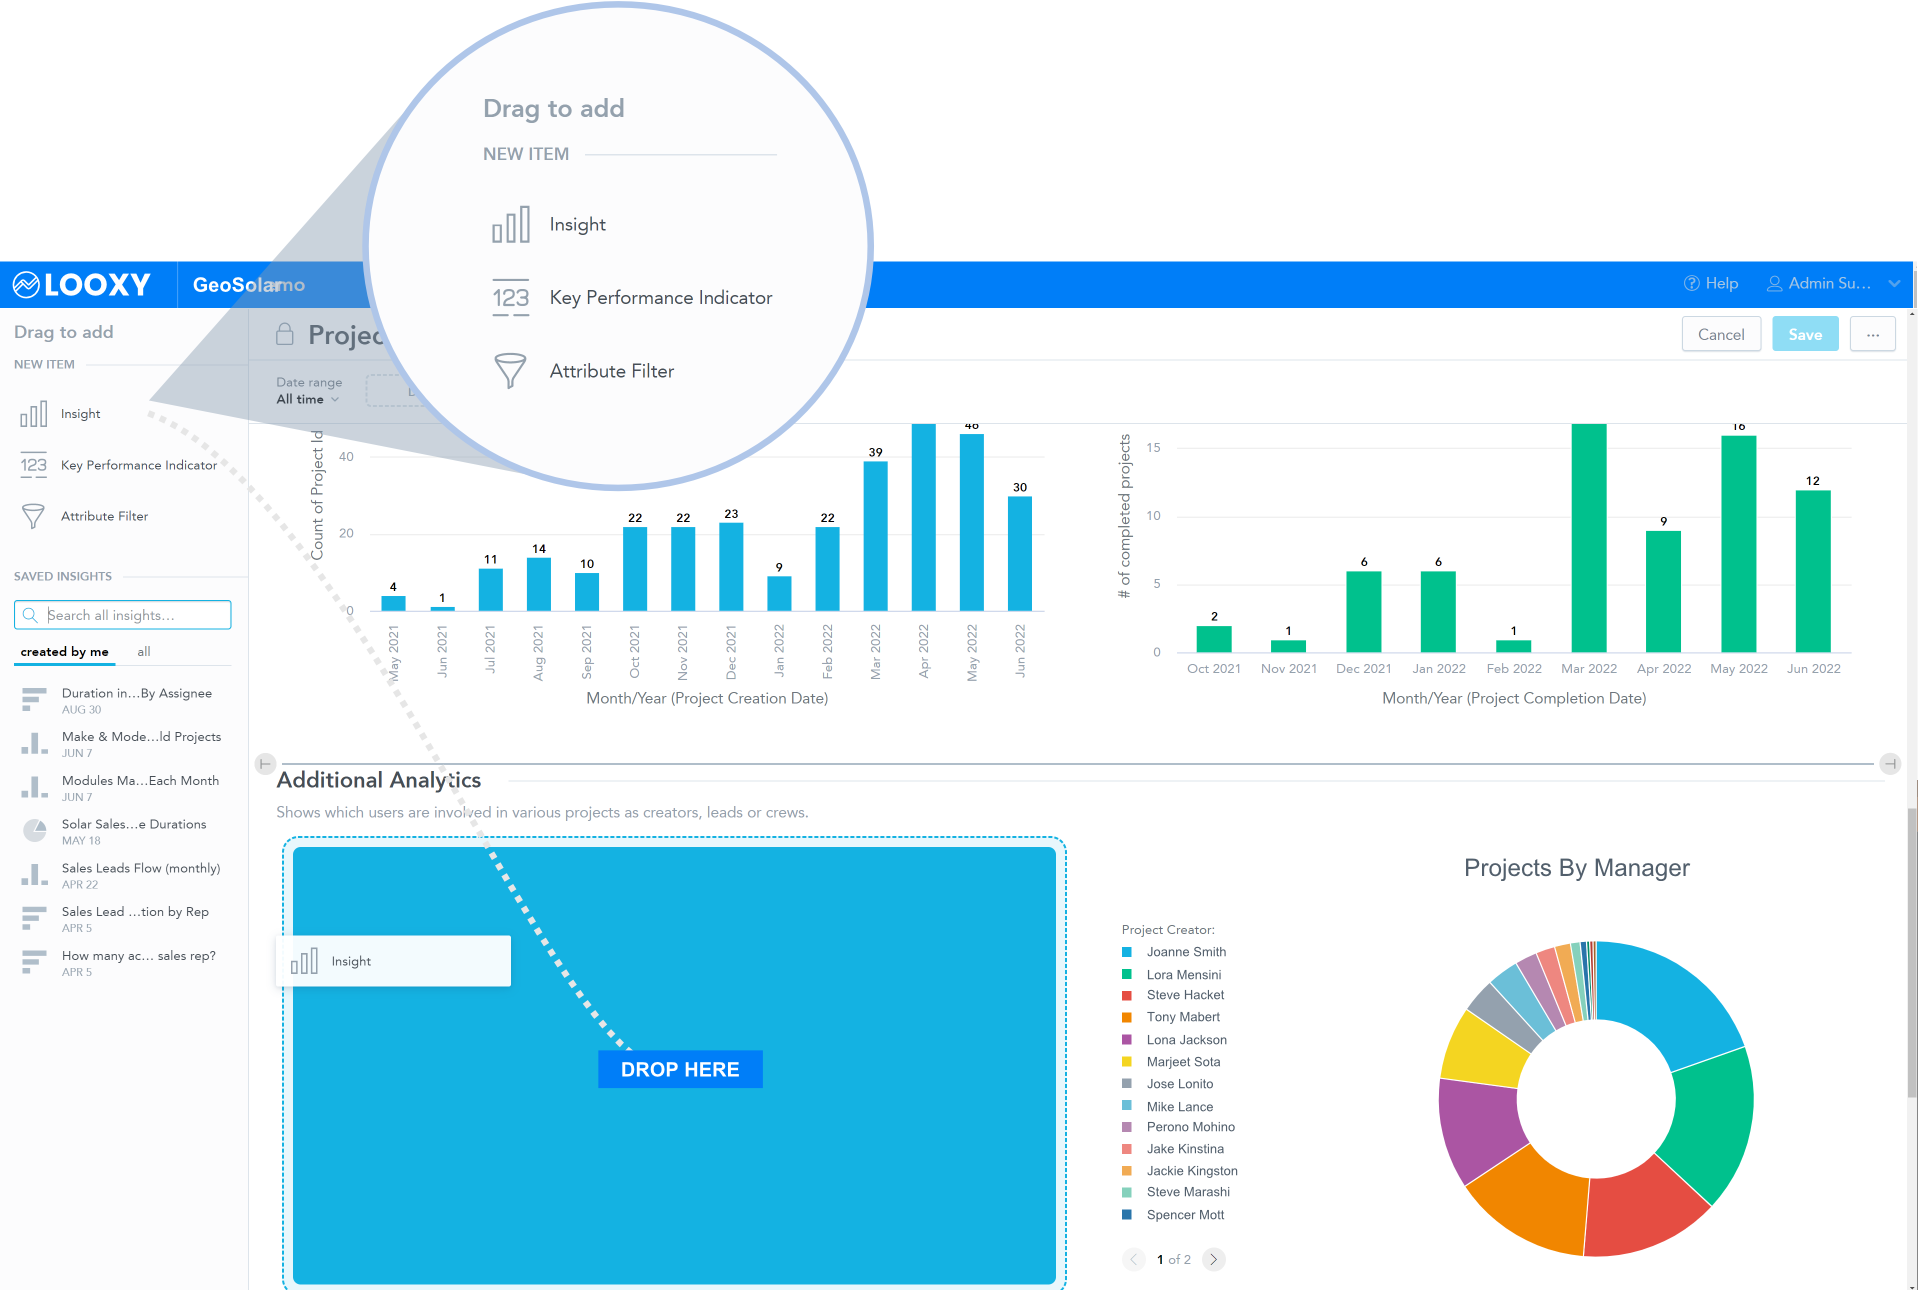
LOOXY™ by Scoop is an advanced reporting and analytics platform that is tied directly to solar sales, installation, and service management data. This means that as field and office activities occur, the data updates automatically in your reporting dashboard.
LOOXY visualizes everything from deals and contract value in various stages of your pipeline, sales rep monthly commission reports, number of service visits in a given time period, invoicing timelines for each project, and more. The drag-and-drop builder, flexible data filters, and report exporter make it simple to leverage these insights and make more informed business decisions.
3 Dashboards to Streamline Operations
1. Solar Sales Dashboard
If you are a solar executive, one of the first dashboards you will want to create is to analyze your solar sales team and its performance. There should be a variety of sales-related reports on this dashboard that allow you to review the activities of your sales reps and external partners, including how many leads are being generated and actively worked in a given period, their close percentage, estimated deal size, and commission reports for each team member. These reports likely include:
- Number of deals created and closed in a given period
- Number of deals in various stages of the funnel
- Estimated contract value in various stages of the funnel
- Trend analysis of time spent in each sales stage
- Pipeline reports by sales rep, partner, and region
- Deals close rate by rep, partner, and region
- Number of deals by project type (e.g. commercial vs. residential, solar vs. EV charging)
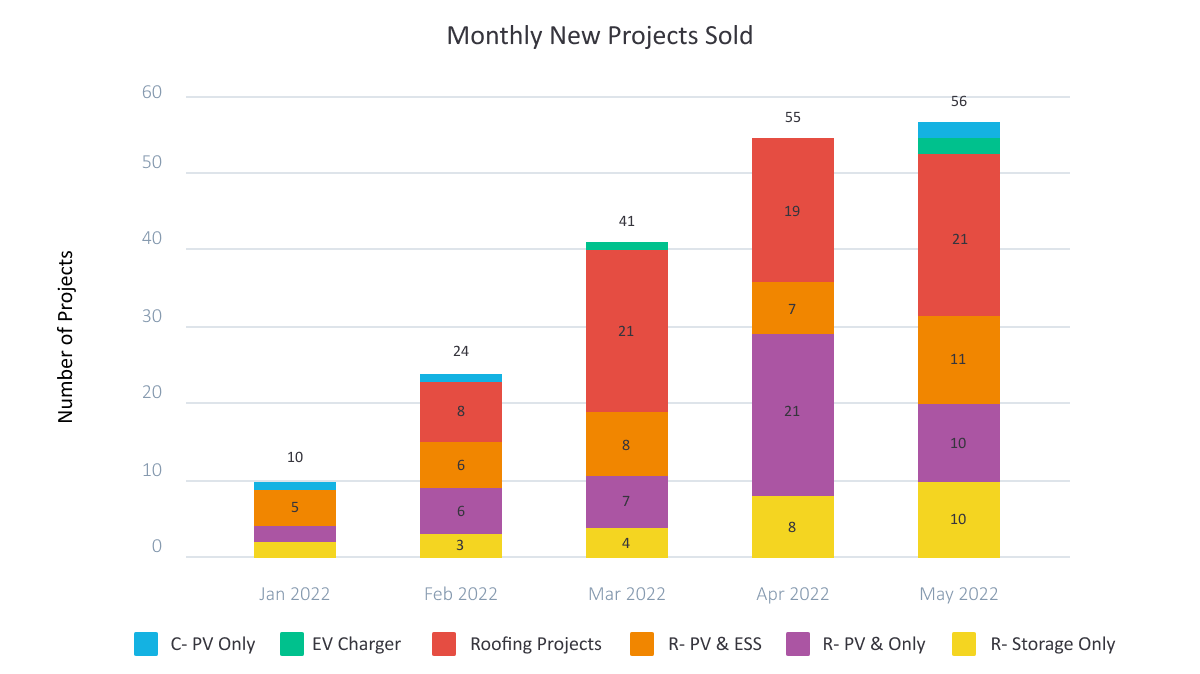
2. Field Installation Dashboard
The second important dashboard for solar executives should examine the real-time status of ongoing work orders and installations. Production and installation teams have a pivotal role in ensuring that projects move along smoothly and as planned. Not only is this information valuable for solar executives to gain a better understanding of current operations, but it can also help inventory teams prepare any required materials for upcoming projects. Your field installation dashboard should include reports such as:
- Pipeline reports by installation phase (e.g. site survey, design, permitting, closeout, etc.)
- Trend analysis of time spent in each installation phase by project manager, partner, or region
- Map visualization of installation project locations by region and street address
- Materials required in early project phases to communicate with inventory teams
- Summary of the make, model, and quantity of required materials (e.g. panels, inverters, etc.)
- Payment timelines and due dates for each project milestone
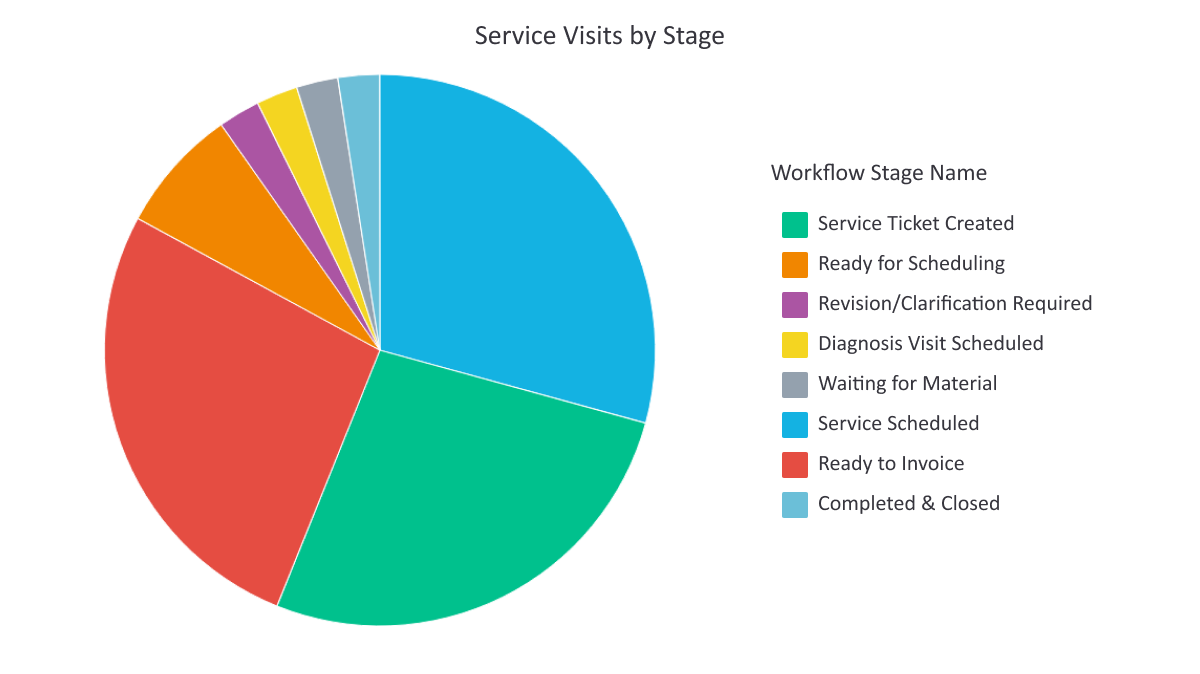
3. Service Activity Dashboard
The final set of reports that solar executives need to streamline operations is a service activity dashboard. In order to reduce costs, save time, and increase capacity to grow your business, you will need an overview of all service visits as well as the ability to zoom into granular details such as warranties, scheduling, parts replacement, and so on. An effective service and maintenance operations dashboard will report on:
- Number of service visits in a given period
- Number of scheduled vs. unscheduled visits
- Ratio of visits covered under warranty
- Number of service visits requiring part replacements
- Summary of the make, model, and quantity of parts being replaced
- Average time to resolution by service type, rep, partners and region
- Trend analysis of time spent in each service stage
These three dashboards provide solar executives with various reports, including performance breakdowns and trend analyses, to streamline operations and make more informed business decisions. Manual methods of reporting, such as disconnected spreadsheets, can be unreliable and time-consuming. If your team is looking to achieve automatic updates and intuitive reporting dashboards, contact our team today.