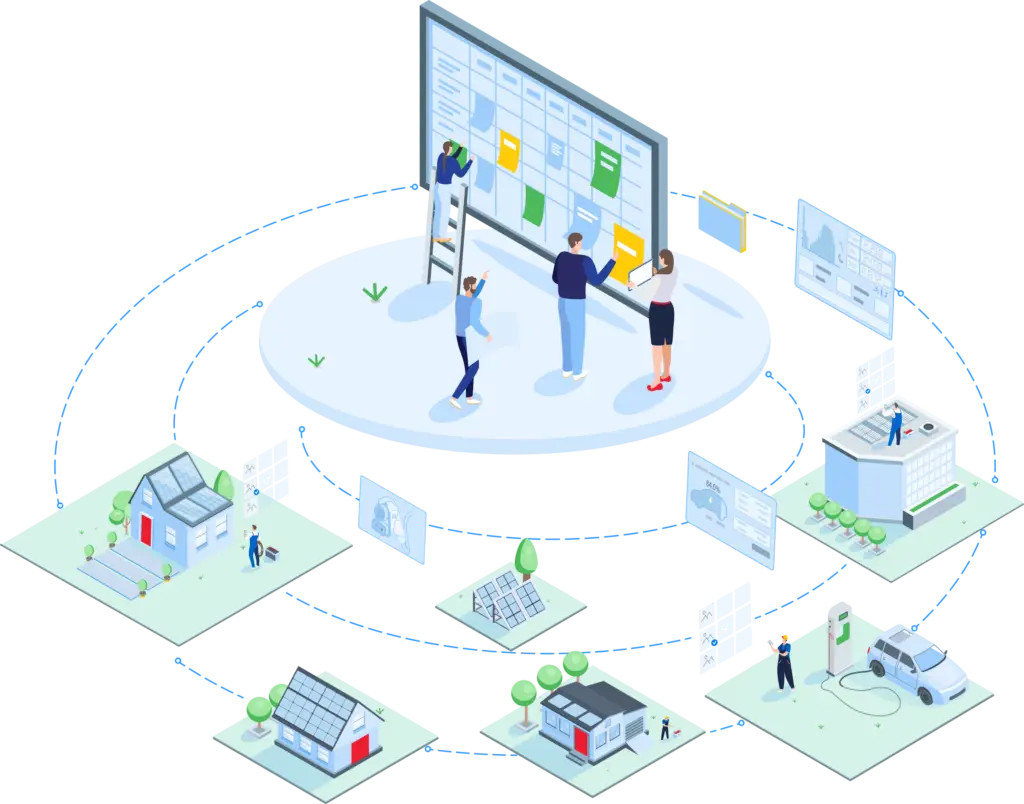
Field service metrics are the key performance indicators (KPIs) that measure how efficiently your technicians work, how well you serve customers, and how much each job earns. The core field service KPIs are first-time fix rate, mean time to repair, technician utilization rate, SLA compliance, customer satisfaction, and cost per job.
Tracking field service metrics shows where your operation loses time and money, from repeat site visits to service calls that never get invoiced. Each KPI in this guide comes with its formula and a short example you can apply to your own numbers.
Tracking field service management metrics is key to helping you succeed in field management. By using key performance indicators, you gain a better understanding of how your operations are performing. Closely monitoring these metrics means you can boost efficiency, improve productivity, and keep your customers happy. These metrics help you keep track of service quality, offering actionable insights that highlight areas for improvement. This means better resource allocation and smoother processes. In this article, we’ll explore the 13 most important KPIs that can set you up for success in field service management.
Key Takeaways
- Field service KPIs fall into five groups: efficiency and productivity, customer experience, financial health, asset and inventory, and workforce. Most teams report 5 to 8 KPIs at a time, not all 19.
- First-time fix rate has the widest reach of any field service KPI: each repeat site visit typically costs between $500 and $1,500 and also lowers customer satisfaction and SLA compliance.
- Travel is a direct cost in every job: the IRS standard business mileage rate is 76 cents per mile from July 1, 2026.
- Technician turnover is getting more expensive to fix: the U.S. Bureau of Labor Statistics projects about 569,000 openings a year in installation, maintenance, and repair occupations from 2025 to 2035.
- For O&M and recurring service contracts, SLA compliance, equipment uptime, and preventive maintenance completion rate show whether the contract is delivered and stays profitable.
- Field service metrics are only as accurate as field data. KPIs pulled from one central operations hub, where technicians close work orders with required photos and checklists, remove the monthly spreadsheet rebuild.
What Are Field Service Metrics?
Field service management metrics are measurements of field work: how long jobs take, how often technicians fix the problem on the first visit, what each job costs, and how satisfied customers are afterward. These metrics come from work orders, technician time logs, invoices, and customer surveys, so their accuracy depends on how consistently your team captures data in the field.
Field Service Metrics vs. Field Service KPIs
A field service metric is any number you measure, such as travel time per job. A field service KPI is a metric tied to a business goal and a target, such as raising first-time fix rate to cut truck rolls this quarter. Every KPI is a metric, but only the few that drive your current goals should be reported as KPIs.
Why Field Service Performance Metrics Matter
Field service performance metrics tell you where to act. A falling first-time fix rate points to missing parts or incomplete checklists. A rising invoice cycle time points to paperwork that leaves the field late. Closely monitoring these metrics means you can boost efficiency, improve productivity, and keep your customers happy.

Field Service KPIs Compared
This table lists all 19 field service KPIs with their category, what each one measures, the formula, and which direction counts as improvement.
| # | KPI | Category | What it measures | Formula | Better when |
| 1 | First-time fix rate | Efficiency and productivity | Jobs resolved on the first visit | Jobs resolved on the first visit ÷ total jobs × 100 | Higher |
| 2 | Mean time to repair | Efficiency and productivity | Average time to restore equipment after an issue is reported | Total repair time ÷ number of repairs | Lower |
| 3 | Time to site | Efficiency and productivity | How fast a technician arrives after a request is logged | Total time from request to arrival ÷ number of jobs | Lower |
| 4 | On-time arrival rate | Efficiency and productivity | Visits where the technician arrives inside the promised window | Arrivals within the window ÷ scheduled visits × 100 | Higher |
| 5 | Technician utilization rate | Efficiency and productivity | Share of paid hours spent on billable work | Billable hours ÷ total paid hours × 100 | Higher |
| 6 | Jobs per day | Efficiency and productivity | Jobs completed per technician per working day | Completed jobs ÷ technician working days | Higher |
| 7 | Travel time | Efficiency and productivity | Average driving time between jobs | Total travel hours ÷ number of jobs | Lower |
| 8 | CSAT and NPS | Customer experience | How satisfied customers are with a visit, and how likely they are to recommend you | CSAT: satisfied responses ÷ total responses × 100. NPS: % promoters minus % detractors | Higher |
| 9 | SLA compliance | Customer experience | Jobs completed within contracted response and resolution times | Jobs meeting the SLA ÷ jobs covered by an SLA × 100 | Higher |
| 10 | Repeat visit rate | Customer experience | Jobs that need a return trip for the same issue | Return visits for the same issue ÷ total jobs × 100 | Lower |
| 11 | Customer retention rate | Customer experience | Customers who stay with you over a period | (Customers at end minus new customers) ÷ customers at start × 100 | Higher |
| 12 | Cost per job | Financial health | Full cost of completing one job | (Labor + parts + travel + overhead) ÷ completed jobs | Lower |
| 13 | Job profitability | Financial health | Margin per job after direct costs, and revenue each technician generates | (Job revenue minus direct cost) ÷ job revenue × 100 | Higher |
| 14 | Contract attach rate | Financial health | Customers who buy an ongoing service or maintenance agreement | Customers with a service contract ÷ eligible customers × 100 | Higher |
| 15 | Invoice cycle time | Financial health | Days between finishing a job and sending the invoice | Total days from job completion to invoice ÷ number of invoices | Lower |
| 16 | Parts availability rate | Asset and inventory | Jobs where the technician has every part needed on arrival | Jobs with all parts available ÷ total jobs × 100 | Higher |
| 17 | Equipment uptime | Asset and inventory | Share of scheduled time a customer asset is running | Operating hours ÷ scheduled operating hours × 100 | Higher |
| 18 | PM completion rate | Asset and inventory | Scheduled maintenance tasks completed on time | PM tasks completed on schedule ÷ PM tasks scheduled × 100 | Higher |
| 19 | Technician turnover rate | Workforce | Technicians who leave over a period | Technicians who left ÷ average number of technicians × 100 | Lower |
Efficiency and Productivity KPIs
Efficiency and productivity KPIs track how well your technicians and vehicles turn paid hours into completed work.
1. First-Time Fix Rate (FTFR)
First-time fix rate (FTFR) is the percentage of service calls your technicians resolve on the first visit, without a return trip. A high first-time fix rate translates to happier customers, lower costs, and better efficiency.
Formula: Jobs resolved on the first visit ÷ total jobs × 100
Example: A service team closes 200 work orders in a month, and 164 need no second visit. First-time fix rate is 82%.
To raise first-time fix rate, send technicians with the right parts, the asset’s service history, and a standardized checklist with required photos, so a step cannot be skipped on site. Using knowledge bases and historical data helps your technicians diagnose and fix issues more effectively during their first visit.
2. Mean Time to Repair (MTTR)
Mean time to repair (MTTR) is the average time it takes to restore equipment, measured from the moment an issue is reported to the moment it is fixed. MTTR plays a crucial role in meeting service level agreements (SLAs) and keeping operational costs in check.
Formula: Total repair time ÷ number of repairs
Example: Five inverter faults take 2, 3, 4, 3, and 8 hours to resolve. MTTR is 4 hours.
To reduce MTTR, give technicians the fault details and asset history before they arrive. Providing technicians with remote expert support for complex issues can also help bring down MTTR.
3. Time to Site (Response Time)
Time to site, or response time, measures how quickly your team arrives at a service location after a request is logged. The faster your response time, the more satisfied your clients will be, and the quicker assignments get completed.
Formula: Total time from request to arrival ÷ number of jobs
Example: Three urgent tickets reach site in 3, 5, and 7 hours. Average time to site is 5 hours.
To cut response times, prioritize jobs by urgency and SLA, and dispatch the nearest qualified technician rather than the next one on the calendar. Good field service scheduling matches each job to technician skills, location, and parts before it is assigned.
4. On-Time Arrival and Schedule Adherence
On-time arrival rate is the percentage of visits where the technician arrives inside the window promised to the customer. Schedule adherence measures how many jobs were completed as originally scheduled, without being moved.
Formula: Arrivals within the window ÷ scheduled visits × 100
Example: Technicians arrive inside the promised window on 450 of 500 visits. On-time arrival rate is 90%.
Build realistic job durations into the schedule from your own job history, and send customers automatic updates when a technician is running late.
5. Technician Utilization Rate
Technician utilization rate is the share of paid hours a technician spends on billable work, such as repairs, inspections, and installations. It directly impacts productivity.
Formula: Billable hours ÷ total paid hours × 100
Example: A technician is paid for 40 hours and logs 30 billable hours. Utilization is 75%.
Using field service management software and efficient assignment scheduling helps ensure that your technicians spend most of their time on meaningful tasks. Implementing dynamic scheduling can also accommodate real-time changes, ensuring technicians are always focused on the most important jobs.
6. Jobs Per Day
The number of jobs per day your team completes is a direct measure of productivity. Compare jobs per day only within the same job type, since an installation and a routine inspection are not equal units of work.
Formula: Completed jobs ÷ technician working days
Example: A crew of four technicians completes 60 jobs in a five-day week. Jobs per day is 3 per technician.
Encouraging your technicians to use mobile tools for assignment details, status updates, and real-time communication helps maximize efficiency, ultimately allowing your team to complete more work each day.
7. Travel Time
Travel time is the average time technicians spend driving between jobs. Too much travel time means higher costs and fewer jobs per day.
Formula: Total travel hours ÷ number of jobs
Example: Technicians log 90 driving hours across 120 jobs. Average travel time is 45 minutes per job.
Every mile is a direct cost. The IRS standard business mileage rate is 76 cents per mile from July 1 to December 31, 2026, up from 72.5 cents in the first half of the year. Group jobs by location and use route planning to cut unneeded miles.
Customer Experience KPIs
Customer experience KPIs connect what happens in the field to whether customers renew, refer you, and pay on time.
8. Customer Satisfaction (CSAT) and Net Promoter Score (NPS)
Customer satisfaction (CSAT) reflects how happy your clients are with your service on a specific visit. Net Promoter Score (NPS) measures how likely customers are to recommend your company, on a 0 to 10 scale.
Formula: CSAT: satisfied responses ÷ total responses × 100. NPS: % promoters minus % detractors
Example: Of 100 survey responses, 60 score 9 or 10 (promoters) and 10 score 0 to 6 (detractors). NPS is 50.
Send the survey right after the visit, while the experience is fresh. Empowering your technicians with customer history and preferences also helps personalize the service experience, leading to higher satisfaction.
9. Service Level Agreement (SLA) Compliance
SLA compliance is the percentage of jobs completed within the response and resolution times written into your service level agreements. For operations and maintenance (O&M) providers, it is the KPI that decides whether a contract renews.
Formula: Jobs meeting the SLA ÷ jobs covered by an SLA × 100
Example: An O&M contract covers 80 corrective visits in a quarter, and 76 meet the 48-hour resolution target. SLA compliance is 95%.
Make sure your technicians have mobile access to SLA requirements, along with automated alerts for deadlines, to stay on track and consistently meet expectations. Timestamped photos and completed checklists then give you the proof of SLA performance for client reports.
10. Repeat Visit Rate (Rework Rate)
The rework rate is the percentage of jobs where your technicians need to return to solve the same issue. High rework rates often mean lower first-time fix rates. Each repeat site visit typically costs between $500 and $1,500, depending on whether it is a service call or an installation project.
Formula: Return visits for the same issue ÷ total jobs × 100
Example: Out of 300 jobs in a quarter, 24 need a callback within 30 days. Repeat visit rate is 8%.
Providing in-depth diagnostic tools, standardized smart digital checklists, and remote support options helps technicians get it right during the initial visit. A complete field service report from the first visit also tells the next technician what was already checked and replaced.
11. Customer Retention Rate
Customer retention rate is the percentage of customers who stay with you over a period, such as a year or a contract term. High retention rates show that you are delivering excellent service and supporting business growth.
Formula: (Customers at end minus new customers) ÷ customers at start × 100
Example: You start the year with 200 service customers, add 40, and end with 210. Retention is 85%.
Loyalty programs, personalized communication, and following up after service calls can also help strengthen relationships and boost retention.
Financial KPIs
Financial KPIs translate field activity into margin, cash flow, and recurring service revenue.
12. Cost Per Job
Cost per job is the total cost of completing one service call, including labor, parts, travel, and overhead. Reducing costs per job contributes to greater profitability and efficiency.
Formula: (Labor + parts + travel + overhead) ÷ completed jobs
Example: A month of service work costs $96,000 across 320 jobs. Cost per job is $300.
Using inventory management tools can also keep parts expenses in check, and analyzing historical data helps you spot opportunities to cut unnecessary spending.
13. Job Profitability and Revenue per Technician
Job profitability shows how much margin each job earns after direct costs. Revenue per technician shows how much revenue each field worker generates over a period, which is total service revenue divided by the number of billable technicians.
Formula: (Job revenue minus direct cost) ÷ job revenue × 100
Example: A $1,200 maintenance visit has $780 in direct costs. Job margin is 35%.
[Image: Financial dashboard | alt text: Field service metrics dashboard showing job profit margin by project]
To improve profitability, analyze cost structures, optimize pricing, and eliminate unnecessary expenses.
14. Contract Attach Rate
Contract attach rate is the percentage of customers who buy an ongoing maintenance or service agreement with their installation or repair. It matters most to installers building an O&M business because every attached contract turns a one-time project into recurring service revenue.
Formula: Customers with a service contract ÷ eligible customers × 100
Example: Of 150 commercial installations completed this year, 54 add a maintenance agreement. Contract attach rate is 36%.
15. Invoice Cycle Time
Invoice cycle time measures how many days pass between completing a job and sending the invoice. Invoice-to-cash cycle time extends the same measure to the day you are paid.
Formula: Total days from job completion to invoice ÷ number of invoices
Example: Ten jobs are invoiced 1, 2, 2, 3, 3, 4, 5, 6, 7, and 7 days after completion. Average invoice cycle time is 4 days.
Trigger the invoice automatically when the technician closes the work order, so completed visits are never left unbilled.
Asset and Inventory KPIs
Asset and inventory KPIs show whether customer equipment stays running and whether technicians have the parts to fix it.
16. Parts Availability Rate
Parts availability rate is the percentage of jobs where the technician has every part needed, on the truck or on site, at arrival. A missing part lowers first-time fix rate and raises MTTR at the same time.
Formula: Jobs with all parts available ÷ total jobs × 100
Example: Technicians had every part they needed on 270 of 300 jobs. Parts availability rate is 90%.
Track which parts are replaced most often by asset type, and stock vehicles from that history.
17. Equipment Uptime
Equipment uptime is the percentage of scheduled time a customer asset is running, such as an inverter, a battery storage system, a charging station, or a wind turbine. Uptime is the result most O&M clients pay for.
Formula: Operating hours ÷ scheduled operating hours × 100
Example: A charging station scheduled to run 720 hours in a month is down for 18 hours. Uptime is 97.5%.
Turn monitoring alarms into work orders automatically, so the fault reaches a technician without someone retyping it.
18. Preventive Maintenance Completion Rate
Preventive maintenance (PM) completion rate is the percentage of scheduled maintenance tasks your team completes on time. For O&M providers it is a leading indicator: missed preventive visits show up later as lower uptime and more corrective repairs.
Formula: PM tasks completed on schedule ÷ PM tasks scheduled × 100
Example: An O&M team schedules 120 quarterly inspections and completes 114 on time. PM completion rate is 95%.
Workforce KPIs
Workforce KPIs show whether you can keep enough trained technicians to deliver the work you sell.
19. Technician Turnover Rate
Technician turnover rate measures how often technicians leave your company. High turnover means lost efficiency, increased training costs, and overall disruption to scheduled work.
Formula: Technicians who left ÷ average number of technicians × 100
Example: You average 50 technicians over the year and 6 leave. Turnover rate is 12%.
Replacing technicians is getting harder. The U.S. Bureau of Labor Statistics projects about 569,000 openings each year in installation, maintenance, and repair occupations from 2025 to 2035. In Europe, the European Labour Authority 2025 EURES report lists building and related electricians as a shortage occupation in 21 of 28 countries.
Offering career growth opportunities, recognizing achievements, and promoting a healthy work-life balance can significantly reduce turnover, resulting in a stable and motivated workforce.
How to Choose the Right Field Service KPIs
Choose field service KPIs from your business goals, not from the longest list available. Five steps keep the list short and useful:
- Set one goal per quarter, such as cutting repeat visits or protecting margin on service contracts.
- Pick 5 to 8 KPIs that move that goal. Pair a leading indicator, such as parts availability rate, with the result you want, such as first-time fix rate.
- Set a baseline from the last 90 days before you set a target.
- Assign an owner and a review cadence. Review dispatch KPIs daily, productivity KPIs weekly, financial KPIs monthly, and customer and asset KPIs quarterly.
- Segment by job type. Installations, corrective repairs, and preventive visits each have a different normal range.
How to Track Field Service Metrics in One System
Field service KPIs are only as accurate as the data behind them. When work orders sit in one tool, timesheets in another, and invoices in a third, someone rebuilds the numbers in a spreadsheet every month, and the report arrives too late to act on.
Scoop is a central operations hub for installation, service, and O&M teams. Technicians close work orders in the Scoop mobile app with required photos, checklists, and timestamps, so first-time fix rate, SLA compliance, and invoice cycle time come from the same records your crews create on site. Teams managing crews on build sites use the same workflows through our construction field team management software.
Scoop’s LOOXY reporting and analytics module adds unlimited dashboards and KPI modeling across projects, work orders, and sites, with scheduled reports for managers and clients. Pacific Power Solutions grew from a two-person operation to 30 field technicians running its O&M business on Scoop.
To see what else changes after you adopt a platform, read about the benefits of field service management software, or compare platforms in our guide to the best field service management software.
Track Your Field Service KPIs in One Place
Bring a service workflow you are running right now to a 20-minute discovery call, and we will show you how Scoop turns it into live field service KPIs, from first-time fix rate to SLA compliance. Unlimited users, storage, and devices on every plan.

No credit card, no obligation, and a response the same business day. Book a demo
Frequently Asked Questions About Field Service Metrics
What are the most important field service metrics?
The most important field service metrics are first-time fix rate, mean time to repair, technician utilization rate, SLA compliance, customer satisfaction, and cost per job. Together they cover efficiency, customer experience, and profitability. O&M providers should add equipment uptime and preventive maintenance completion rate because recurring service contracts are judged on both.
What is the difference between field service metrics and KPIs?
A field service metric is any measurement of field work, such as travel time per job or jobs per day. A field service KPI is a metric tied to a specific business goal and target, such as raising first-time fix rate this quarter. Most teams measure dozens of metrics but report 5 to 8 KPIs.
What are some field service KPI examples?
Common field service KPI examples include first-time fix rate, mean time to repair, time to site, technician utilization rate, SLA compliance, customer satisfaction (CSAT), Net Promoter Score (NPS), cost per job, contract attach rate, invoice cycle time, equipment uptime, and technician turnover rate. Each one measures a different part of field operations, from dispatch to billing.
What is a good first-time fix rate?
A good first-time fix rate depends on the job type. In our experience, many field service teams aim for 80% or higher on corrective service calls, while complex repairs on large equipment run lower and routine maintenance visits run higher. Compare your rate against your own baseline by job type, and track parts availability alongside it.
How do you calculate technician utilization rate?
Technician utilization rate equals billable hours divided by total paid hours, multiplied by 100. A technician paid for 40 hours who logs 30 billable hours has a utilization rate of 75%. Travel, training, and waiting for parts count as non-billable time, so a low rate often points to scheduling gaps or long drives between jobs.
Which field service KPIs matter most for O&M and recurring maintenance?
For operations and maintenance (O&M) contracts, track SLA compliance, equipment uptime, preventive maintenance completion rate, mean time to repair, and repeat visit rate. These KPIs show whether you are delivering the contract and whether it stays profitable. Timestamped photos and work order history give you the proof of SLA performance for client reports.
How often should you review field service KPIs?
Review dispatch KPIs such as time to site and on-time arrival daily, productivity KPIs such as utilization and jobs per day weekly, and financial KPIs such as cost per job and invoice cycle time monthly. Review customer and asset KPIs, including NPS, retention, and equipment uptime, quarterly, when there is enough data to show a trend.
What software tracks field service management KPIs?
Field service management software tracks KPIs by recording work orders, technician time, parts, and invoices in one system. Scoop is a central operations hub for installation, service, and O&M teams, and its LOOXY reporting module builds dashboards for KPIs such as first-time fix rate, SLA compliance, and cost per job from the data technicians capture in the field.