Renewable energy portfolios are expanding faster than the teams and systems built to maintain them. As solar, wind, and battery storage capacity grows, operations and maintenance (O&M) programs determine whether these assets deliver reliable performance or fall short of their financial projections. This guide covers O&M management fundamentals, cost benchmarks, technology shifts, and best practices for teams running renewable energy portfolios in 2026.
Renewable energy moves in waves. Government incentives, financing cycles, and broader market conditions can lift solar, wind, and battery storage one year and pull entire companies under the next, leaving behind built infrastructure that still needs to produce power.
For operations and maintenance (O&M) teams, that volatility is opening up a real opportunity: portfolios from companies that didn’t make it through the last market cycle are now looking for operators who can take them over and keep the assets running.
This guide covers O&M fundamentals, cost benchmarks, technology shifts, and best practices for teams ready to step into that role in 2026.
What Is Renewable Energy Operations and Maintenance?
Renewable energy O&M covers every planned and unplanned activity required to keep solar, wind, and battery storage assets producing power safely and profitably. The scope starts at commissioning and extends through the full asset lifecycle, including decommissioning.
Operations and maintenance split into two distinct functions:
- Operations: real-time monitoring, dispatch coordination, compliance reporting, and administrative management of the asset portfolio.
- Maintenance: preventive inspections on a fixed schedule, corrective repairs when equipment fails, and predictive interventions triggered by data patterns before a fault causes downtime.
The system that ties these functions together determines how effectively a renewable energy portfolio performs over time. A structured O&M program offers a single coordinated workflow that connects monitoring, field execution, and reporting, so issues are caught early and resolved before they compound.
Preventive Maintenance and Scheduled Inspections
Preventive maintenance follows a fixed schedule designed to catch degradation before it triggers unplanned downtime. The cadence depends on asset type and operating environment, but most solar and wind facilities follow a layered approach:
- Monthly visual inspections of panels, inverters, and structural components
- Quarterly electrical testing (IV curve tracing, thermographic scans, connection integrity)
- Annual comprehensive reviews covering all equipment, cabling, and site conditions
Solar facilities require routine panel cleaning, inverter servicing, tracker alignment checks, and vegetation management around the array perimeter. Soiling alone can reduce annual solar generation by several percentage points when cleaning schedules fall behind. Wind assets add blade inspections, gearbox fluid sampling, and pitch system calibration to the preventive cycle.
Keeping these schedules consistent across multiple facilities is what separates high-production portfolios from those bleeding output to avoidable faults.

Corrective Maintenance and Fault Resolution
Corrective maintenance kicks in when equipment fails or performance drops below expected thresholds. Common triggers include:
- Inverter shutdowns
- Panel micro-cracks detected during thermographic scans
- Turbine gearbox faults
- Underground cable degradation
The speed of the response depends on how well the service team handles dispatch and spare parts logistics. 3 elements minimize downtime:
- Clear work order process
- Pre-positioned replacement components
- Defined escalation paths
Without that support structure, a single inverter failure can cascade into days of lost generation across an entire string.
Reliability over the long term comes down to closing the loop: every corrective event should feed back into the preventive schedule so the same failure mode doesn’t repeat across the fleet.
Performance Monitoring and Data Management
Performance monitoring systems form the backbone of modern renewable energy O&M. SCADA platforms, inverter-level tracking, and string-level analytics feed real-time data into a centralized system where operators can spot anomalies before they escalate into corrective events.
Weather-normalized performance ratios give teams a standardized way to measure actual production against expected output. When a site’s ratio drops, the data points directly to the underperforming equipment or string, which shortens diagnosis time and improves dispatch efficiency.
That same data feeds predictive and corrective maintenance workflows. Patterns in inverter degradation curves, temperature trends, and production dips become the triggers for scheduled interventions, closing the gap between monitoring and field action.
The quality of these programs has a direct financial impact on the asset’s lifecycle, and the numbers show exactly how much is at stake.
Why Does Renewable Energy O&M Matter for Long-Term Asset Performance?
O&M accounts for 20-25% of total lifecycle costs for wind and solar plants. That makes it one of the largest controllable line items in a renewable energy project’s operating budget, and one of the few areas where disciplined execution directly improves long-term returns.
The connection between O&M quality and asset performance runs through every layer of the business. Investor confidence depends on predictable production. Warranty compliance requires documented maintenance records. Grid reliability commitments demand consistent uptime. When O&M programs fall short, the effects compound: degraded efficiency, shortened equipment life, and eroded profitability across the portfolio.
Financial Impact of Proactive Renewable Energy Maintenance
Skipping or delaying maintenance creates costs that compound faster than most operators expect. Unplanned downtime is the most visible hit: every hour a turbine or inverter sits offline is lost production that can’t be recovered. But the less obvious costs often do more damage over time:
- Voided warranties from missed maintenance intervals force operators to absorb repair costs that manufacturers would have covered.
- Accelerated panel degradation from deferred cleaning or unchecked hot spots shortens the asset’s productive life.
- Underperforming systems erode commercial returns for investors who underwrote the project based on specific production targets.
Proactive O&M flips this equation. Teams that invest in structured preventive programs and real-time monitoring consistently report lower operating costs per MWh and stronger efficiency ratios as their portfolios scale.
How Do Renewable Energy Teams Maintain Safety and Compliance?
Renewable energy sites carry specific hazards that standard industrial safety protocols don’t fully address. Each asset class brings its own risk profile:
- Solar arrays: electrical arc flash risks during live maintenance
- Wind turbines: working at heights with specialized fall protection
- Battery storage systems: confined space entry and thermal runaway protocols that demand dedicated training
OSHA requirements set the baseline, but compliance obligations extend further. Solar operators reporting under NERC GADS must document outage events and equipment availability. Environmental regulations vary by jurisdiction and can affect vegetation management practices, wildlife mitigation plans, and site drainage. Keeping up with these requirements across distributed facilities means structured documentation and consistent field procedures at every site.
The specific hazards and compliance demands also vary by technology, which is why solar, wind, and storage O&M programs each follow distinct operational playbooks.
How Do Solar and Wind Power O&M Programs Differ?
Solar, wind power, and battery storage share the same operational principles, but the specific maintenance activities, cost structures, and risk profiles differ across technologies. Monitoring, preventive schedules, and corrective response form the foundation of every renewable energy O&M program. The differences show up in what gets inspected, how often, and what it costs to keep each asset class performing.
| Asset class | Core preventive activities | Key cost driver | Market signal |
| Solar | Thermographic scans, IV curve tracing, inverter monitoring, tracker alignment, module cleaning | Site scale and vegetation management | Costs declining per doubling of installed capacity |
| Wind | Blade inspections, gearbox and bearing maintenance, pitch and yaw system servicing, foundation checks | Onshore vs. offshore access | $15.86B in 2022, projected $27.24B by 2030 |
| Battery storage | Cell-level temperature monitoring, state-of-health assessments, HVAC system maintenance, fire suppression checks | Aging cells and safety protocols | US: 37.4 GW installed, 19 GW under construction |
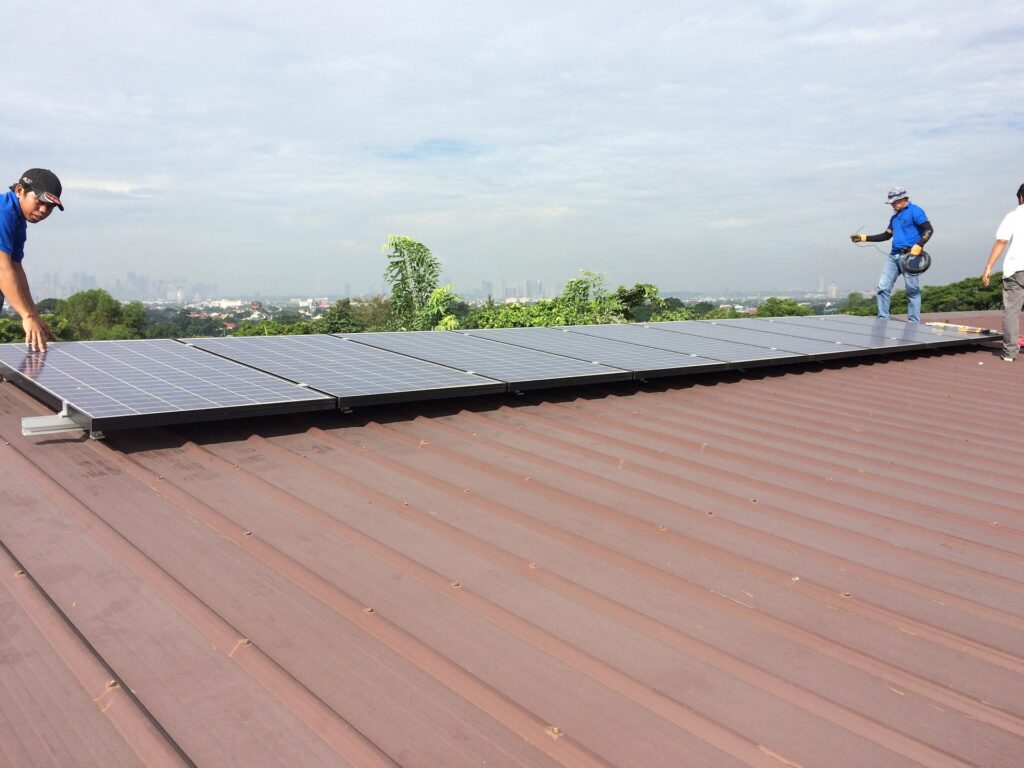
Solar Panel Performance, Inverter Health, and Site Maintenance
Solar O&M centers on keeping panels, inverters, and balance-of-system components operating at peak efficiency. Routine inspections cover the full array:
- Thermographic scans to detect hot spots
- IV curve tracing to measure cell-level output
- Inverter monitoring to catch performance drops before they spread across the array
- Tracker alignment checks and module cleaning to round out the preventive cycle
Commercial and utility-scale solar sites share the same core activities, but the scale changes the logistics. A 5 MW rooftop system might need a single technician for quarterly inspections. A 200 MW ground-mount facility requires coordinated teams, vegetation management across hundreds of acres, and performance monitoring systems that track thousands of individual strings.
Solar O&M costs have declined steadily as cumulative operational experience grows across the industry. Each doubling of installed capacity has driven measurable cost reductions in both preventive and corrective maintenance, making solar one of the most cost-efficient asset classes to maintain at scale.

Wind Turbine Inspections, Component Replacement, and Offshore O&M
Wind power O&M revolves around mechanical systems that operate under constant stress from wind loads, vibration, and weather exposure. The core preventive program covers four component groups:
- Blade inspections
- Gearbox and bearing maintenance
- Pitch and yaw system servicing
- Foundation checks
Each component carries its own failure mode and inspection cadence.
Blade inspections increasingly rely on drone-based thermography and high-resolution imaging, replacing manual rope-access methods that are slower and carry higher safety risks. Gearbox oil sampling and vibration analysis catch bearing wear early, giving service teams time to schedule replacements during low-wind periods rather than responding to emergency shutdowns that compromise fleet reliability.
The cost gap between onshore and offshore wind turbine O&M is significant. Offshore facilities require specialized vessels, weather-dependent access windows, and equipment rated for marine conditions, all of which push per-turbine maintenance costs well above onshore equivalents. The global wind turbine O&M market reached $15.86B in 2022 and is projected to hit $27.24B by 2030 (Grand View Research), driven by aging fleets and the continued expansion of offshore capacity.
What Are the O&M Requirements for Battery Storage Systems?
Battery energy storage systems (BESS) introduce O&M requirements that don’t exist in solar or wind programs. The core of a BESS preventive program covers:
- Cell-level temperature monitoring
- State-of-health assessments
- HVAC system maintenance
- Fire suppression checks
Each of these activities generates data that feeds directly into capacity planning and degradation modeling.
Safety protocols are more complex than for other asset types. Three systems must be tested on a fixed schedule:
- Thermal runaway detection
- Gas monitoring systems
- Emergency ventilation
As battery fleets age, the frequency and depth of these checks increase, which means O&M costs per site grow over the life of the installation.
The scale of this new O&M category is expanding fast. US storage capacity reached 37.4 GW by October 2025, with another 19 GW under construction (Deloitte). Every gigawatt added creates a long-term maintenance obligation that didn’t exist a few years ago.
Across solar, wind, and storage, execution quality depends on the practices teams put in place.
What Are the Best Practices for Renewable Energy O&M Teams?
The most effective O&M programs combine standardized processes, skilled teams, and connected technology into a repeatable operating model. Three key areas consistently separate high-performing O&M organizations from those struggling to keep up with portfolio growth.
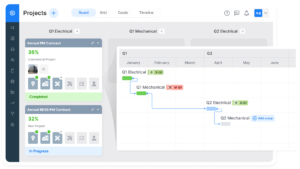
Combine Best-in-Class Tools in One Operational Layer
No single platform handles the full scope of renewable energy O&M well, and trying to force the operation into one all-in-one almost always leaves gaps somewhere on the stack. Performance monitoring, field documentation, scheduling and dispatch, SLA tracking, and invoicing each have purpose-built tools that do that one job well. Stretching a single system to cover all of them usually means giving up depth in the areas that matter most.
The more durable pattern is to pick the best-in-class tool for each function and connect them through a central operational layer. Monitoring platforms surface alerts and asset data. Field apps capture inspections and work orders. Scheduling tools coordinate dispatch. Accounting systems handle invoicing triggers. A hub layer keeps these tools in sync, so technicians, dispatchers, and back-office teams work from the same source of truth without re-keying data between systems.
This approach also keeps the operation flexible. As portfolios grow or stronger tools come on the market, an O&M team can swap in a better monitoring platform or a more capable field app without rebuilding the entire stack. The connective layer absorbs the change instead of forcing a re-platform.
Standardize Workflows and Field Documentation
Repeatable processes are the foundation of scalable O&M. Checklists, standardized inspection forms, and digital work orders reduce errors, speed up onboarding for new technicians, and create auditable records that satisfy compliance requirements. When every site follows the same documentation standards, teams working across multiple facilities can move between locations without relearning local procedures.
The shift from paper-based or spreadsheet-driven tracking to structured digital workflows is one of the fastest ways to optimize solar operations and maintenance. Standardized data capture in the field feeds directly into reporting and analytics, which means the information collected during a routine inspection doesn’t sit in a folder, it flows into the operating system that drives the next decision.
Use Data-Driven Decision Making to Reduce Downtime
The gap between reactive and proactive O&M comes down to how teams use the data they already collect. Tracking availability, performance ratio, and mean time to repair gives operations managers a clear picture of where the portfolio is underperforming and why. These metrics create a feedback loop between performance monitoring, maintenance scheduling, and long-term asset strategy.
Continuous improvement depends on structured reporting. When field data flows into centralized dashboards that track trends over weeks and months, patterns become visible that individual work orders can’t reveal. Teams that act on this data consistently report lower downtime, better efficiency ratios, and stronger reliability across their portfolios, because every maintenance decision is informed by what the numbers actually show.
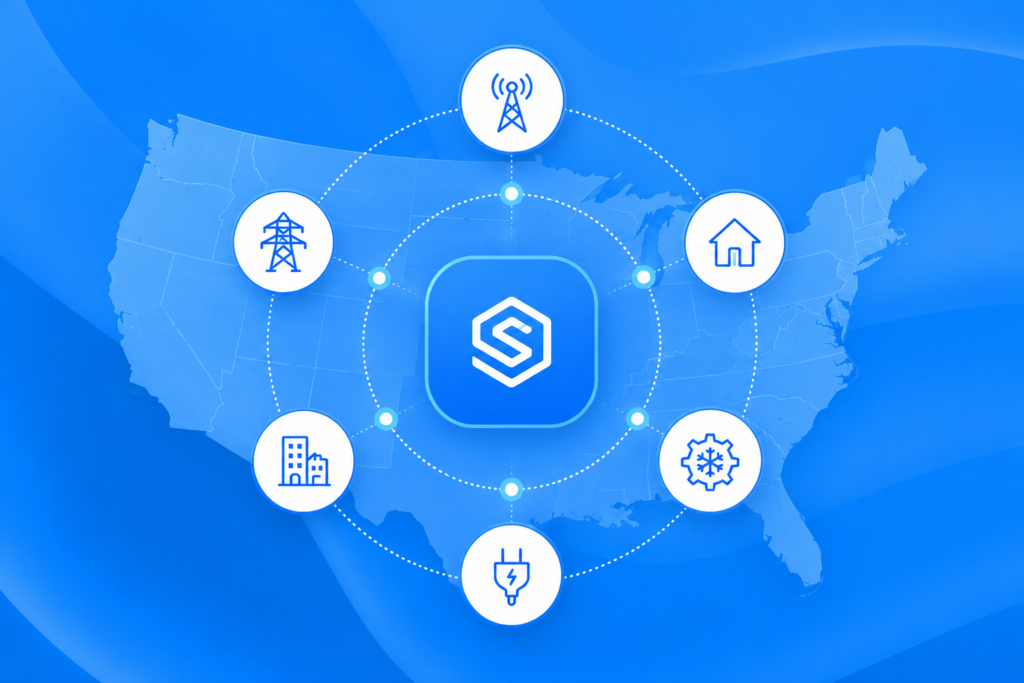
Strengthen Renewable Energy O&M with Scoop
We built Scoop as the Central Operations Hub that connects monitoring, dispatch, field execution, and reporting for renewable energy O&M teams managing solar, wind, and storage portfolios. We connect your scheduling, work orders, and team communication in one platform, so your operations scale without adding complexity. Book a demo to see how Scoop can streamline your O&M management.
Frequently Asked Questions About Renewable Energy Operations and Maintenance
What Does Renewable Energy Operations and Maintenance Include?
O&M includes performance monitoring, preventive maintenance, corrective repairs, safety inspections, compliance reporting, and administrative management of renewable energy assets. The scope covers solar, wind, and battery storage systems from commissioning through decommissioning.
How Often Should Solar and Wind Assets Be Inspected?
Solar panels typically require annual thermographic inspections and semi-annual visual inspections, with cleaning schedules adjusted based on soiling conditions. Wind turbines require semi-annual to annual comprehensive inspections depending on manufacturer guidelines, site conditions, and component age.
How Does Predictive Maintenance Improve Renewable Energy Asset Performance?
Predictive maintenance uses machine learning models and real-time sensor data to detect component degradation before failures cause unplanned downtime. By scheduling repairs during low-production periods, O&M teams extend equipment life and reduce emergency dispatch costs across their portfolios.
What Role Do Drones Play in Solar and Wind Inspections?
Drones equipped with thermal cameras and high-resolution imaging complete panel scans and blade surface inspections faster and more safely than manual methods. The captured data feeds directly into work order systems, so identified faults can be dispatched for repair the same day.
What Is the Difference Between Onshore and Offshore Wind O&M?
Onshore wind O&M relies on standard vehicle access and land-based crews, while offshore O&M requires specialized vessels, marine-rated equipment, and weather-dependent access windows. These additional logistical requirements push offshore per-turbine maintenance costs well above onshore equivalents.
How Do Battery Storage O&M Requirements Differ From Solar and Wind?
Battery energy storage systems require cell-level temperature monitoring, state-of-health assessments, fire suppression testing, and thermal runaway detection protocols that do not exist in solar or wind programs. As battery fleets age, these checks increase in frequency and depth, driving higher per-site O&M costs over the life of the installation.