Field Service Management Market (US): Executive Summary
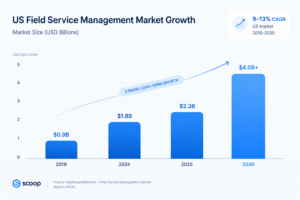
The United States field service management market has emerged from the pandemic larger, cloud-first, and more services-dependent than before 2020. It is estimated at roughly USD 2.1 billion to 2.4 billion in 2025 on a software-plus-services basis⁵ ⁸, a materially higher baseline than its pre-pandemic level, and it is on track to roughly double by the early 2030s at high single-digit to low double-digit annual growth.
Cloud delivery now defines the market, and technology drives competition. Cloud and SaaS account for 60 to 68 percent of deployment, on-premise has receded to regulated niches, and more than 90 percent of service organizations have adopted some form of artificial intelligence³. These capabilities push revenue toward recurring subscriptions and raise the value of each deployment.
The market is moderately fragmented, and its published size is widely misread. No provider dominates, and the leading firms hold an estimated 36 to 45 percent of revenue. Estimates for 2025 span USD 1.4 billion to 2.9 billion, a spread caused by scope and geography rather than real disagreement, so any figure should be checked against its definition before use.
US Field Service Management Market Growth Analysis (2019 to 2024)
Market Structure Before 2020
Before 2020 the US field service management market was small, software-led, and growing quickly off a modest base. The global market stood at approximately USD 2.8 billion¹⁰ in 2019, and applying North America’s share of roughly 32 to 38 percent implies a US market in the range of USD 0.8 billion to 1.0 billion that year. That figure is a derived estimate, since no research firm published a discrete US number for 2019, but every reconstruction places the pre-pandemic market well below USD 1.5 billion.
Adoption before the pandemic concentrated in large, asset-intensive operations that already ran structured service organizations. Utilities, telecommunications carriers, manufacturers, and medical-equipment servicers were the early buyers, drawn by the need to coordinate dispatch, work orders, and parts across dispersed field teams. Smaller field-trades contractors largely managed scheduling manually or with general-purpose tools, which left a large unpenetrated base that later became the market’s main growth engine.
COVID Period Market Disruption
The pandemic hit field service with two opposing forces at once, suppressing on-site work while accelerating the software that coordinates it. Lockdowns and customer reluctance sharply cut technician visits, and surveys from the period found that around 61 percent of customers would avoid having a technician enter their premises unless strictly necessary¹¹. Installation, inspection, and non-essential maintenance volumes fell through 2020 and into 2021.
Against that suppression, demand for remote and digital field service rose sharply, and it more than compensated. Organizations adopted augmented-reality-assisted support, video diagnostics, self-service portals, and IoT-based remote monitoring so that work could be triaged or completed without dispatching a person. A 2020 finding showed roughly 80 percent of business customers preferred digital self-service over in-person interaction¹¹, and multi-year digital-transformation plans were compressed into months.
The net effect was continued growth, which sets FSM apart from most service-dependent industries during the pandemic. The global market still expanded by about 12.8 percent in 2020 measured against the 2017 to 2019 average annual growth rate², because the surge in cloud and remote FSM adoption outweighed the decline in on-site service volume. Cloud migration in particular moved from a gradual trend to an operational necessity.
Post Pandemic Stabilization
From 2022 onward the market stabilized at a permanently higher level rather than retreating toward its pre-pandemic size. On-site service volumes recovered as restrictions lifted, but the remote-service capability, cloud infrastructure, and customer self-service expectations built during the crisis remained in place. The global market reached roughly USD 4.9 billion² by 2024, and US estimates for that year cluster around USD 1.75 billion⁵ on a dedicated-report basis.
Hybrid service delivery, combining remote triage with on-site execution, became the standard operating model. The pandemic left service organizations with a structural preference for resolving as much work as possible before dispatching a technician, which reduced costly truck rolls and reshaped how FSM software is configured and valued. This shift is the clearest reason the post-2021 demand base is wider than the pre-2020 one.
By 2024 the market had absorbed the volatility of the pandemic years and entered a more competitive phase. Growth rates moderated from the 2020 to 2021 spike, supply-side disruption faded, and providers that had scaled rapidly during the surge turned to retaining the customers they had won. The result was a larger, more mature market in which differentiation increasingly depended on technology and service depth rather than basic availability.
US Field Service Management Market Forecast (2025 to 2030)
Market Size Projections and CAGR Outlook
The US field service management market is positioned for steady mid-range growth through 2030, expanding without the volatility of the pandemic years. Working from a 2025 base of roughly USD 2.1 billion to 2.4 billion, and applying the consensus growth rates published for the broader market, the US is on track to roughly double by the early 2030s. Global anchors frame the trajectory, with one major firm projecting the worldwide market at USD 9.17 billion¹ by 2030, another at USD 11.78 billion⁴ by 2030, and a third at USD 13.79 billion² by 2034.
Consensus growth sits in the high single digits to low double digits, with two widely cited outliers that should be treated cautiously. Most firms place the compound annual growth rate between 9.5 and 13.3 percent, while a software-only US series runs lower at about 7.7 percent⁷, reflecting a narrower and more mature scope. A dedicated US report projects a 21.57 percent annual rate to 2035⁵, and one global estimate reaches 19.2 percent⁹, both far above every other figure and best read as aggressive cases rather than central forecasts.
Core Growth Drivers
Labor scarcity is the most durable driver, because it makes field technician productivity a direct business constraint. An aging skilled-trades workforce and a persistent shortage of experienced technicians push service organizations toward software that extracts more completed jobs from each available worker. Scheduling automation, route optimization, and mobile job access address that constraint directly.
The shift from on-premise to cloud delivery continues to pull new buyers into the market. Cloud platforms lowered the upfront cost and IT burden of adopting FSM, which opened the category to the small and mid-sized contractors who were previously priced out. Because cloud subscriptions scale with usage, they convert a large historically unpenetrated base into addressable demand.
Connected-device monitoring and predictive maintenance are moving FSM from reactive dispatch toward planned intervention. IoT sensors allow equipment to signal a developing fault before it fails, so that service can be scheduled rather than triggered by a breakdown. The adjacent predictive-maintenance market is itself expanding rapidly, and its growth feeds directly into demand for the FSM systems that act on its signals.
Rising customer expectations for fast, transparent, and contactless service reinforce every other driver. Buyers now expect appointment windows, technician tracking, and digital updates as standard, and meeting those expectations requires the scheduling, mobile, and communication capabilities that FSM platforms provide.
Market Risks and Constraints
Market maturation is the primary constraint, since the pandemic-era surge created a high base that makes further growth incremental. The exceptional adoption of 2020 and 2021 pulled demand forward, and providers that scaled quickly now compete for retention in a more promotion-driven environment. Growth from here depends on deeper penetration of small operators rather than another step change.
Integration complexity and cost continue to slow adoption, particularly among smaller buyers. Connecting FSM software to existing enterprise resource planning and customer relationship management systems is technically demanding, and implementation, training, and support costs deter price-sensitive contractors. These services account for roughly 31 to 32 percent of total market spend, which signals how substantial the non-software cost of adoption remains.
Definitional overlap with adjacent software categories makes the market harder to measure and to sell against. FSM shares boundaries with workforce management, enterprise asset management, and home-services scheduling software, which complicates both market sizing and a buyer’s ability to isolate the return on a dedicated FSM purchase.
Market Segmentation by Component and Deployment
Software and Services
The market divides into a dominant software component and a substantial services component, and the split itself drives most published disagreement about market size. Software, meaning the platforms and applications themselves, accounts for roughly 58 to 68 percent of total spend, while services, covering implementation, integration, consulting, training, and support, make up the remaining 31 to 32 percent. A figure that counts only software will therefore sit far below one that counts software plus services for the same market.
The services component grows alongside software because every deployment requires configuration and ongoing support. As FSM platforms add artificial intelligence and connected-device features, the implementation work needed to realize their value increases rather than shrinks. That dynamic keeps services a structural share of the market rather than a one-time cost that disappears as the category matures.
Cloud and On-Premise Deployment
Cloud deployment has become the clear majority of the US market and continues to take share from on-premise systems. Cloud and SaaS systems represent roughly 60 to 68 percent of deployment, with one US report placing the cloud segment near USD 1.05 billion⁵ in 2024. On-premise systems remain a declining residual, concentrated in defense, government, and other sectors with strict data-control requirements.
On-premise deployment is not vanishing, but its role has narrowed to specific regulatory and security cases. For the broader market, the deployment question is effectively settled in favor of cloud.
Solution Types and Mobile Access
Within the software component, scheduling and dispatch is the largest solution type, reflecting the core problem FSM was built to solve. Scheduling, dispatch, and route optimization account for the single biggest slice of solution revenue, with reporting and analytics among the fastest-growing categories. Work order management is another major category, and US figures place it among the larger solution types by revenue.
Mobile access has shifted from a feature to the primary way field technicians use FSM software. Field workers increasingly treat a handheld device as their main tool for receiving jobs, accessing customer history, and closing work orders, and providers cite mobile capability as a leading reason buyers choose one platform over another. No firm sizes mobile FSM as a separate revenue line, but its adoption growth runs ahead of the overall market.
Market Segmentation by End User and Industry
Large Enterprises and Small Businesses
Large enterprises hold the majority of FSM spending, but small and mid-sized businesses are the faster-growing buyer group. Large organizations account for roughly 56 to 60 percent of the market by organization size³ ⁶, drawn by the need to coordinate large, dispersed service workforces. Small and mid-sized businesses, by contrast, are expanding their adoption at an estimated 16 to 17 percent annually, well above the overall market rate.
The small-business segment matters disproportionately because its starting penetration is so low. Many small field-service contractors still manage scheduling manually, which means cloud FSM is converting a large untapped base rather than displacing existing systems. That headroom is the main reason the segment grows faster than the enterprise tier even though it spends less in absolute terms.
Field Trades and Home Services
The field trades, covering heating, ventilation, plumbing, and electrical work, are among the most active FSM adopters in the US. Adoption here separates into two distinct demand pools, commercial and industrial contracting on one side and residential home services on the other, and the two behave differently enough to be treated as separate sub-markets.
Residential home services has emerged as the larger and faster-growing opportunity of the two. The underlying base of residential contractors is vast and highly fragmented, much of it still operating without dedicated software, which gives FSM platforms a long runway of operators left to digitize.
Private-equity consolidation of trades contractors is reshaping how FSM software reaches this segment. As investors roll up independent heating, plumbing, and electrical businesses into larger groups, the combined entities standardize on common FSM platforms, which concentrates buying power and accelerates adoption. This demand-side consolidation is now one of the clearest growth signals in the residential trades.
Telecom, Energy, Healthcare and Other Verticals
Beyond the trades, FSM demand is anchored by a set of asset-intensive industries that depend on coordinated field work. Telecommunications has historically been the single largest end-use vertical, with one firm placing it near 30 percent of the global market in an earlier reading⁴, while energy and utilities and manufacturing each represent roughly a fifth of the market in more recent estimates. Healthcare and medical-device servicing is repeatedly cited as one of the faster-growing verticals.
Vertical figures diverge across firms, because each research house draws the industry boundaries differently. Telecom, energy, and manufacturing are consistently named as the largest verticals, but their exact shares depend on whether a firm separates oil and gas from utilities, or counts construction trades as a distinct category. The reliable conclusion is the set of leading verticals, not the precise percentage attached to each.
Strategic Insights for Investors and B2B Buyers
High Growth Segments
Growth in the US market is concentrated in specific segments rather than spread evenly across the category. Cloud and SaaS deployment, the small-business buyer tier, and residential home services each grow faster than the overall market, and they share a common feature, since each converts a previously unpenetrated base into recurring subscription revenue.
Predictive maintenance and connected-service capabilities are the most attractive area for technology-led growth. Equipment monitoring shifts service from reactive repair to scheduled intervention, which raises the value of an FSM deployment and supports higher pricing. The model also produces recurring revenue and stronger customer retention than a one-time software sale.
On the demand side, consolidated trades operators and institutional buyers offer the most predictable expansion. Private-equity-backed contractor groups and large institutional service organizations purchase in standardized, contract-based cycles, which provides more stable and forecastable demand than fragmented small-business buying alone.
Competitive Landscape and Market Structure
The US market is moderately fragmented, with no provider holding a dominant national share. The leading providers together account for an estimated 36 to 45 percent of revenue, and the field divides into enterprise-software incumbents that bundle field service into broader suites and specialist providers focused on particular trades or company sizes. That structure keeps competitive intensity high across every tier.
Consolidation is occurring on both sides of the market at once. Software providers are acquiring one another to broaden their capabilities, while the service contractors who buy FSM are themselves being rolled up into larger groups. A landmark public listing in the sector in late 2024 signalled investor confidence in the category and is likely to sustain both acquisition activity and capital investment.
Reading the Market Estimates
Any buyer or investor researching this market will find published US figures that appear to contradict one another, and understanding why is essential. Estimates for the 2025 US market range from roughly USD 1.4 billion to USD 2.9 billion, and occasionally a figure above USD 5 billion appears. The spread is not a sign that the data is unreliable, because it reflects two specific methodological choices.
The first cause is scope, meaning whether a figure counts software only or software plus services. Software-only estimates exclude implementation, consulting, training, and support, which represent roughly 31 to 32 percent of total spend, so a software-plus-services figure is structurally larger for the same market. The second cause is geography, since a direct US estimate built from US provider revenue differs from one derived by applying a North America share, between 31.7 and 37.9 percent, to a global total. Derived figures land lower, around USD 1.4 billion to 1.8 billion, while direct estimates run from USD 2.1 billion to 2.9 billion.
The defensible reading is a 2025 US market of roughly USD 1.8 billion to 2.9 billion, with a working point estimate near USD 2.0 billion to 2.4 billion on a software-plus-services basis. Any figure at or above USD 5 billion is almost certainly a global number mislabeled as US, since the worldwide market itself is only USD 5.1 billion to 5.7 billion in 2025¹ ² ³ ⁶. A buyer should always confirm a source’s scope and geography before comparing one estimate to another.
Sources
- MarketsandMarkets, Field Service Management Market: https://www.marketsandmarkets.com/Market-Reports/field-service-management-market-209977425.html
- Fortune Business Insights, Field Service Management Market: https://www.fortunebusinessinsights.com/field-service-management-fsm-market-102215
- Mordor Intelligence, Field Service Management Market: https://www.mordorintelligence.com/industry-reports/field-service-management-market
- Grand View Research, Field Service Management Market: https://www.grandviewresearch.com/industry-analysis/field-service-management-market
- Market Research Future, US Field Service Management Market: https://www.marketresearchfuture.com/reports/us-field-service-management-market-15465
- GM Insights, Field Service Management Market: https://www.gminsights.com/industry-analysis/field-service-management-market
- IBISWorld, Field Service Management Software in the US: https://www.ibisworld.com/united-states/market-size/field-service-management-software/5393/
- P&S Market Research, US Field Service Management Software Market: https://www.psmarketresearch.com/market-analysis/us-field-service-management-software-market-report
- Allied Market Research, Field Service Management Market: https://www.alliedmarketresearch.com/field-service-management-market
- MarketsandMarkets, 2019 global FSM baseline (GlobeNewswire): https://www.globenewswire.com/news-release/2020/01/13/1969488/0/en/The-global-field-service-management-market-size-is-expected-to-grow-from-USD-2-8-billion-in-2019-to-USD-5-9-billion-by-2024-at-a-CAGR-of-16-2.html
- Field Service News, Understanding Virtual Field Service (2021): https://www.fieldservicenews.com/research-report-understanding-virtual-field-service-part-one-2021/